Sizing and Scaling your Cloud Native Compiler Installation
Table of Contents
In order for the Cloud Native Compiler to perform the JIT compilation in time, you need to make sure the installation is sized correctly. You scale Cloud Native Compiler by specifying the total number of vCores you wish to allocate to the service. The Helm chart automatically sets the sizing of the individual CNC components.
Scaling Overview
Scaling CNC is controlled by how much capacity CNC has to process compilation requests. This is controlled by the amount of vCores CNC has been provisioned.
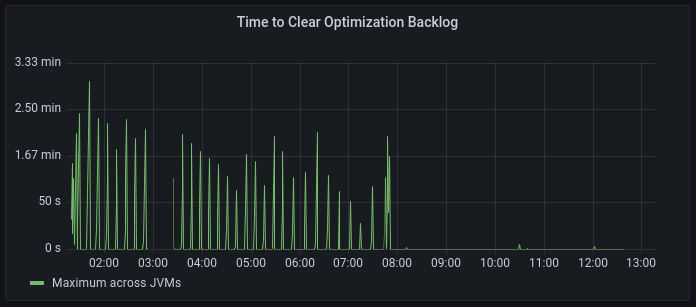
A critical metric to measure whether your CNC is responding to compilation requests in time is the Time to Clear Optimization Backlog (TCOB). When you start a Java program, there is a burst of compilation activity as a large amount of optimization requests are put on the compilation queue. Eventually, the compiler catches up with the optimization backlog and all new compilation requests are started within 2 seconds of being put on the compilation queue. The TCOB is the measurement, for each individual JVM, of how long it took from the start of the compilation activity to when the optimization backlog is cleared.
To find the right amount of CNC vCores to provision for a job, first determine an acceptable TCOB for your application. Different applications will find different TCOBs acceptable depending on how many optimizations the program requests and how quickly you need to warm it up. As a starting point, set the amount of time you want to wait before the application is ready to accept requests as your target TCOB.
Perform a test run of a single JVM against your CNC. In Grafana, check the Time to Clear Optimization Backlog and Compilations in Progress graphs.
-
If the maximum TCOB during your application’s warmup is lower than your target, you can scale down the number of vCores provisioned for the job.
-
If the maximum TCOB is higher than your target, check the Compilations in Progress metric in Grafana. This metric shows you actual compilations in progress versus CNC capacity. If you are using the full capacity, add more vCores to the CNC capacity.
You should also check the client JVM logs to see whether the JVM fell back to using local compilation. JVMs switch to local compilation when CNC becomes unresponsive or tells the JVM that it cannot handle any new requests.
Configuring CNC Capacity
Depending on your autoscaling settings, there are three variables you will need to set:
 $ simpleSizing:
$   vCores: 29
$   minVCores: 29
$   maxVCores: 92
-
vCores- Total number of vCores that will be allocated to CNC. This does NOT include resources required by monitoring, if you enable it. The minimum amount of vCores for provisioning CNC is 29. -
minVCores- The minimum amount of resources that are always allocated when autoscaling is enabled. -
maxVCores- The maximum amount of resources that are allocated when autoscaling is enabled.
Configuring Autoscaling
Since Cloud Native Compiler (CNC) uses a large amount of resources, it is imperative to correctly configure autoscaling. Kubernetes Horizontal Pod Autoscaler (HPA) automatically increases/decreases the number of pods in a replication controller, deployment, replica set or stateful set based on observed CPU utilization.
Autoscaling is enabled by default in the Helm chart. To disable autoscaling, add the following to values-override.yaml:
$ autoscaler: false
If you use the Azul-provided cluster config file, the pre-defined node groups for the gateway, compile-broker and cache components already contain instructions to work with Autoscaler. If the Autoscaler Node sees any unused nodes, it deletes them. If a replication controller, deployment, or replica set tries to start a container and cannot do it due to lack of resources, the Autoscaler Node knows which service is needed and adds this service to the Kubernetes cluster. For more information, see https://kubernetes.io/docs/tasks/run-application/horizontal-pod-autoscale/.
In order to use HPA autoscaling, you need install the Metrics Server component in Kubernetes.