GC Log Analyzer 26.03.0
Table of Contents
April 2, 2026
What’s new
-
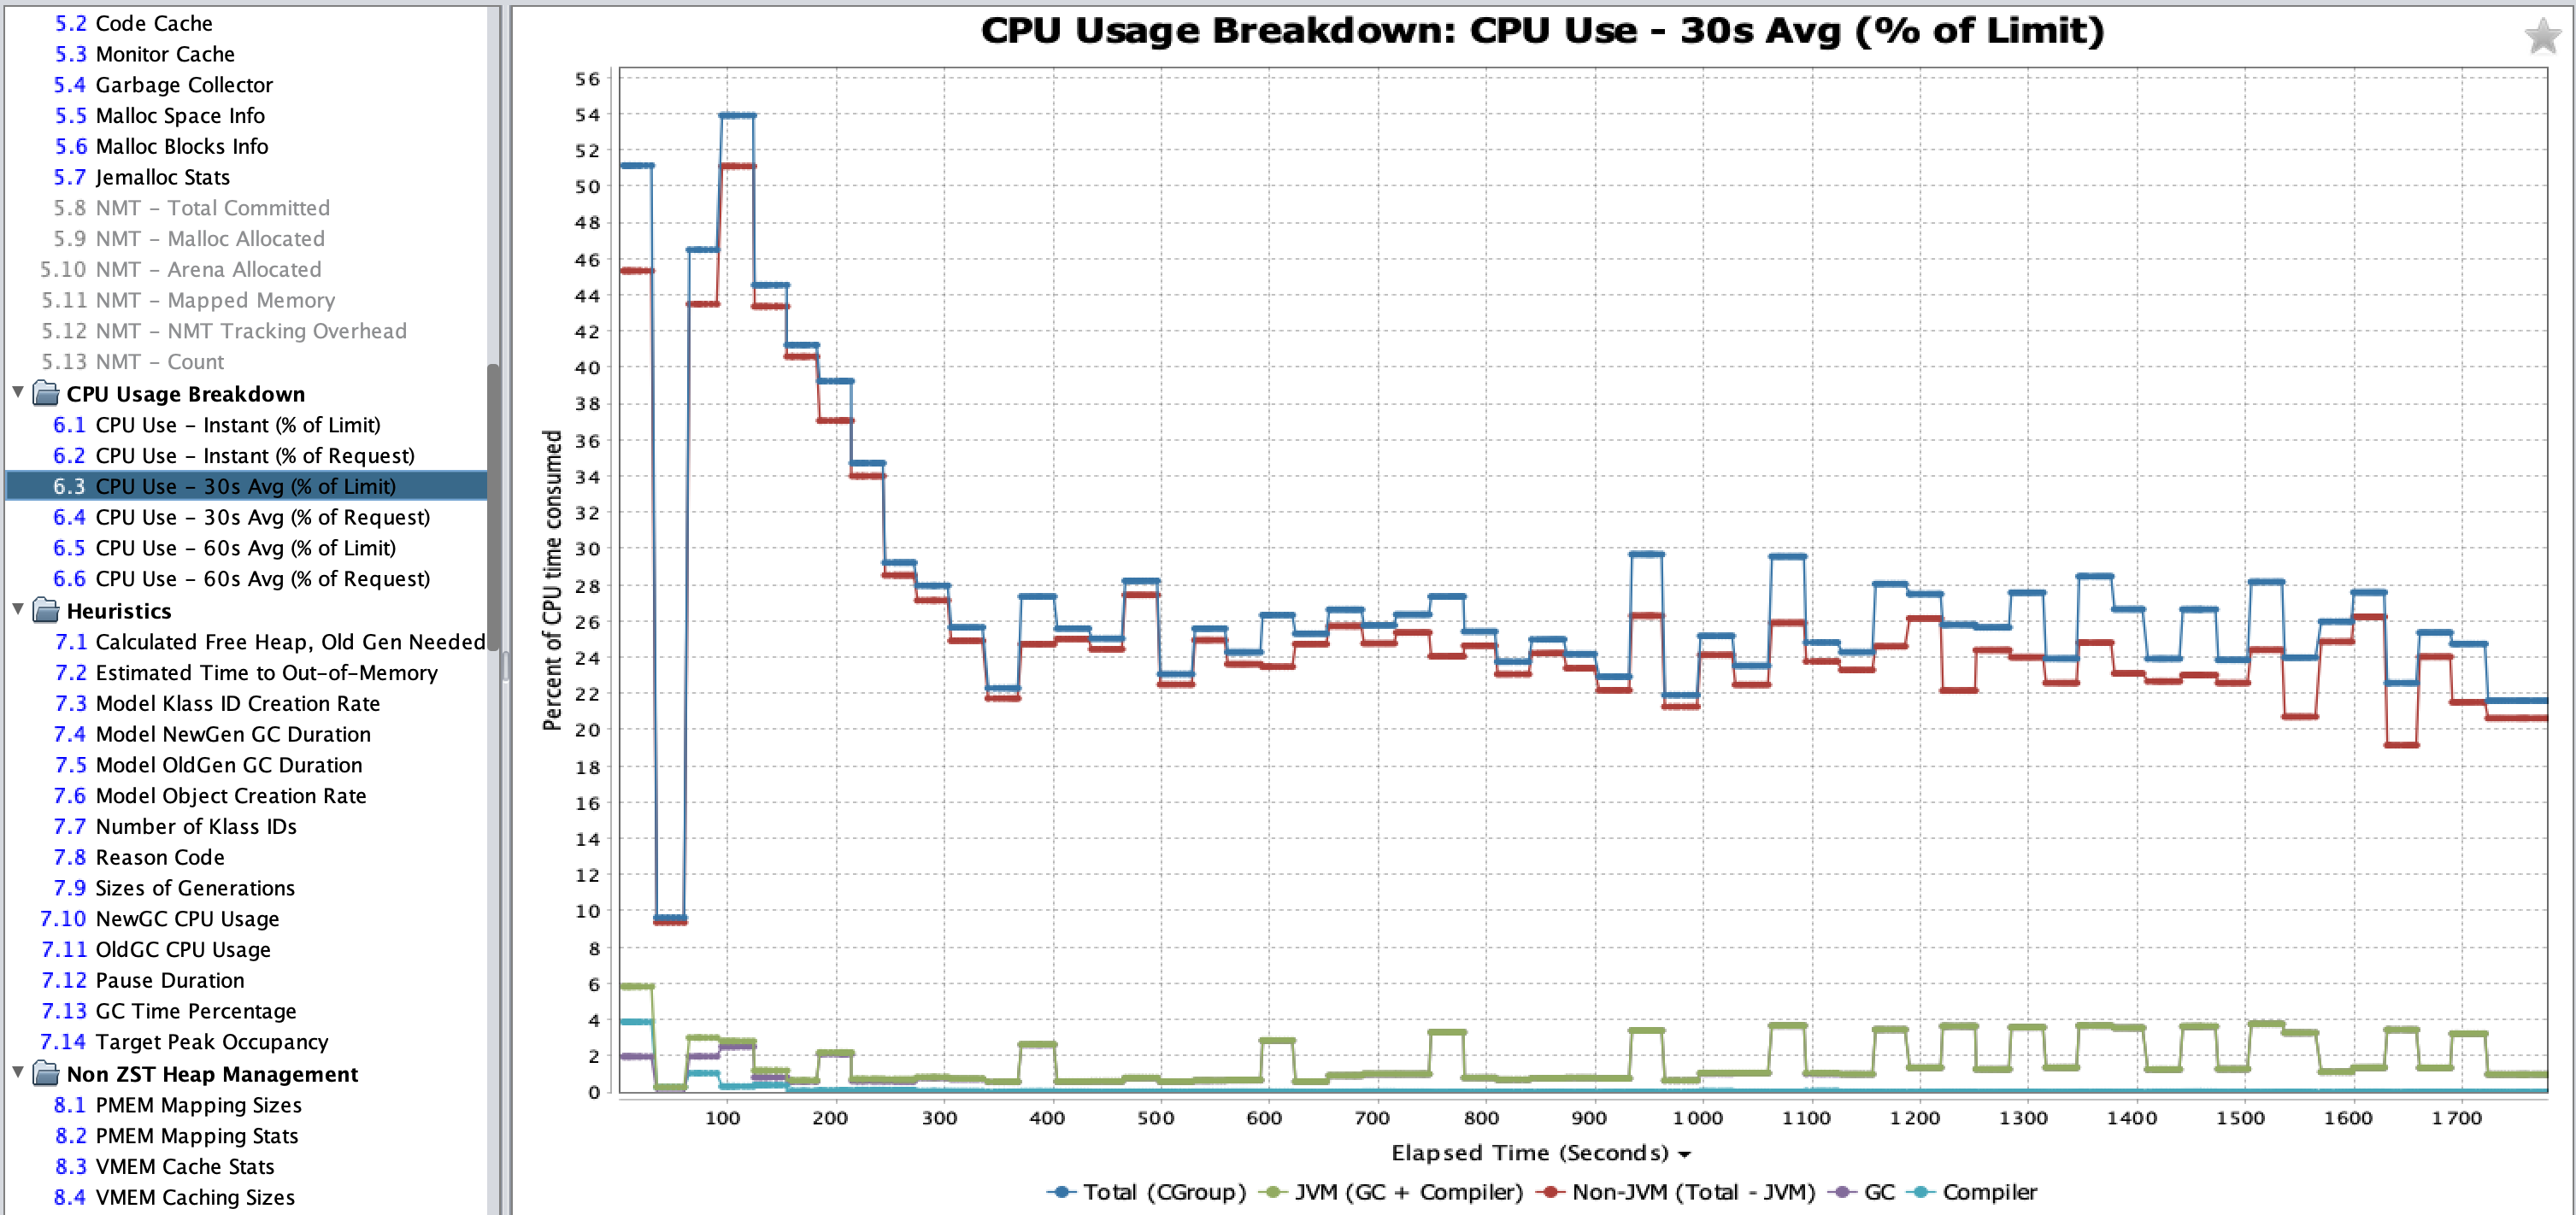
GCLA 26.03.0 introduces three new charts which display a breakdown of CPU usage, plus three extra charts only shown in k8s/CGroup CPU-shares environments. The new CPU breakdown charts show the CPU usage of several components of the JVM in one place. The new charts are listed in the section CPU Usage Breakdown. The following charts have been added:
-
CPU Use - Instant - Includes breakdown of CPU usage by Total (CGroup), JVM (GC + Compiler), Non-JVM (Total - JVM), GC, and Compiler.
-
CPU Use - 30s Avg - Includes the same breakdown statistics, as average blocks every 30 seconds.
-
CPU Use - 60s Avg - Includes the same breakdown statistics, as average blocks every 60 seconds.
-
-
You can now open multiple GC logs at once, which are opened in independent GCLA windows. If you use
File > Open File…, and select multiple GCLA logs, you are now prompted with a window confirming that you would like to open all GC logs at once, in separate, independent GCLA windows.
-
When renaming the GCLA window, the original GC log filename is shown for editing, instead of the current window name.