Usage Instructions for GC Log Analyzer
Working with Graphs
The Garbage Collector Log Analyzer (GC Log Analyzer) offers more than 70 different graphs of log file data that provide insight into the behavior and performance of your application, Zing, and the runtime environment.
Most of the time, you need to quickly know whether the overall system is performing well. To accomplish this task, you can consult the required group of graphs that helps you visualize the GC activity and detect performance anomalies.
Opening a GC Log File
To open a GC Log file, specify the path to your GC Log file as an argument when starting the GC Log Analyzer (e.g., java -jar GCLogAnalyzer2.jar gc.log).
Alternatively, run the GC Log Analyzer and use any of the following options to open your GC Log file:
-
Select File > Open File from the main menu. In the dialog box that opens, browse for your log file and click Open.
-
Drag your GC Log file and drop it in the GC Log Analyzer window.
-
Choose Open Recent Files from the File menu to view files you’ve recently opened.
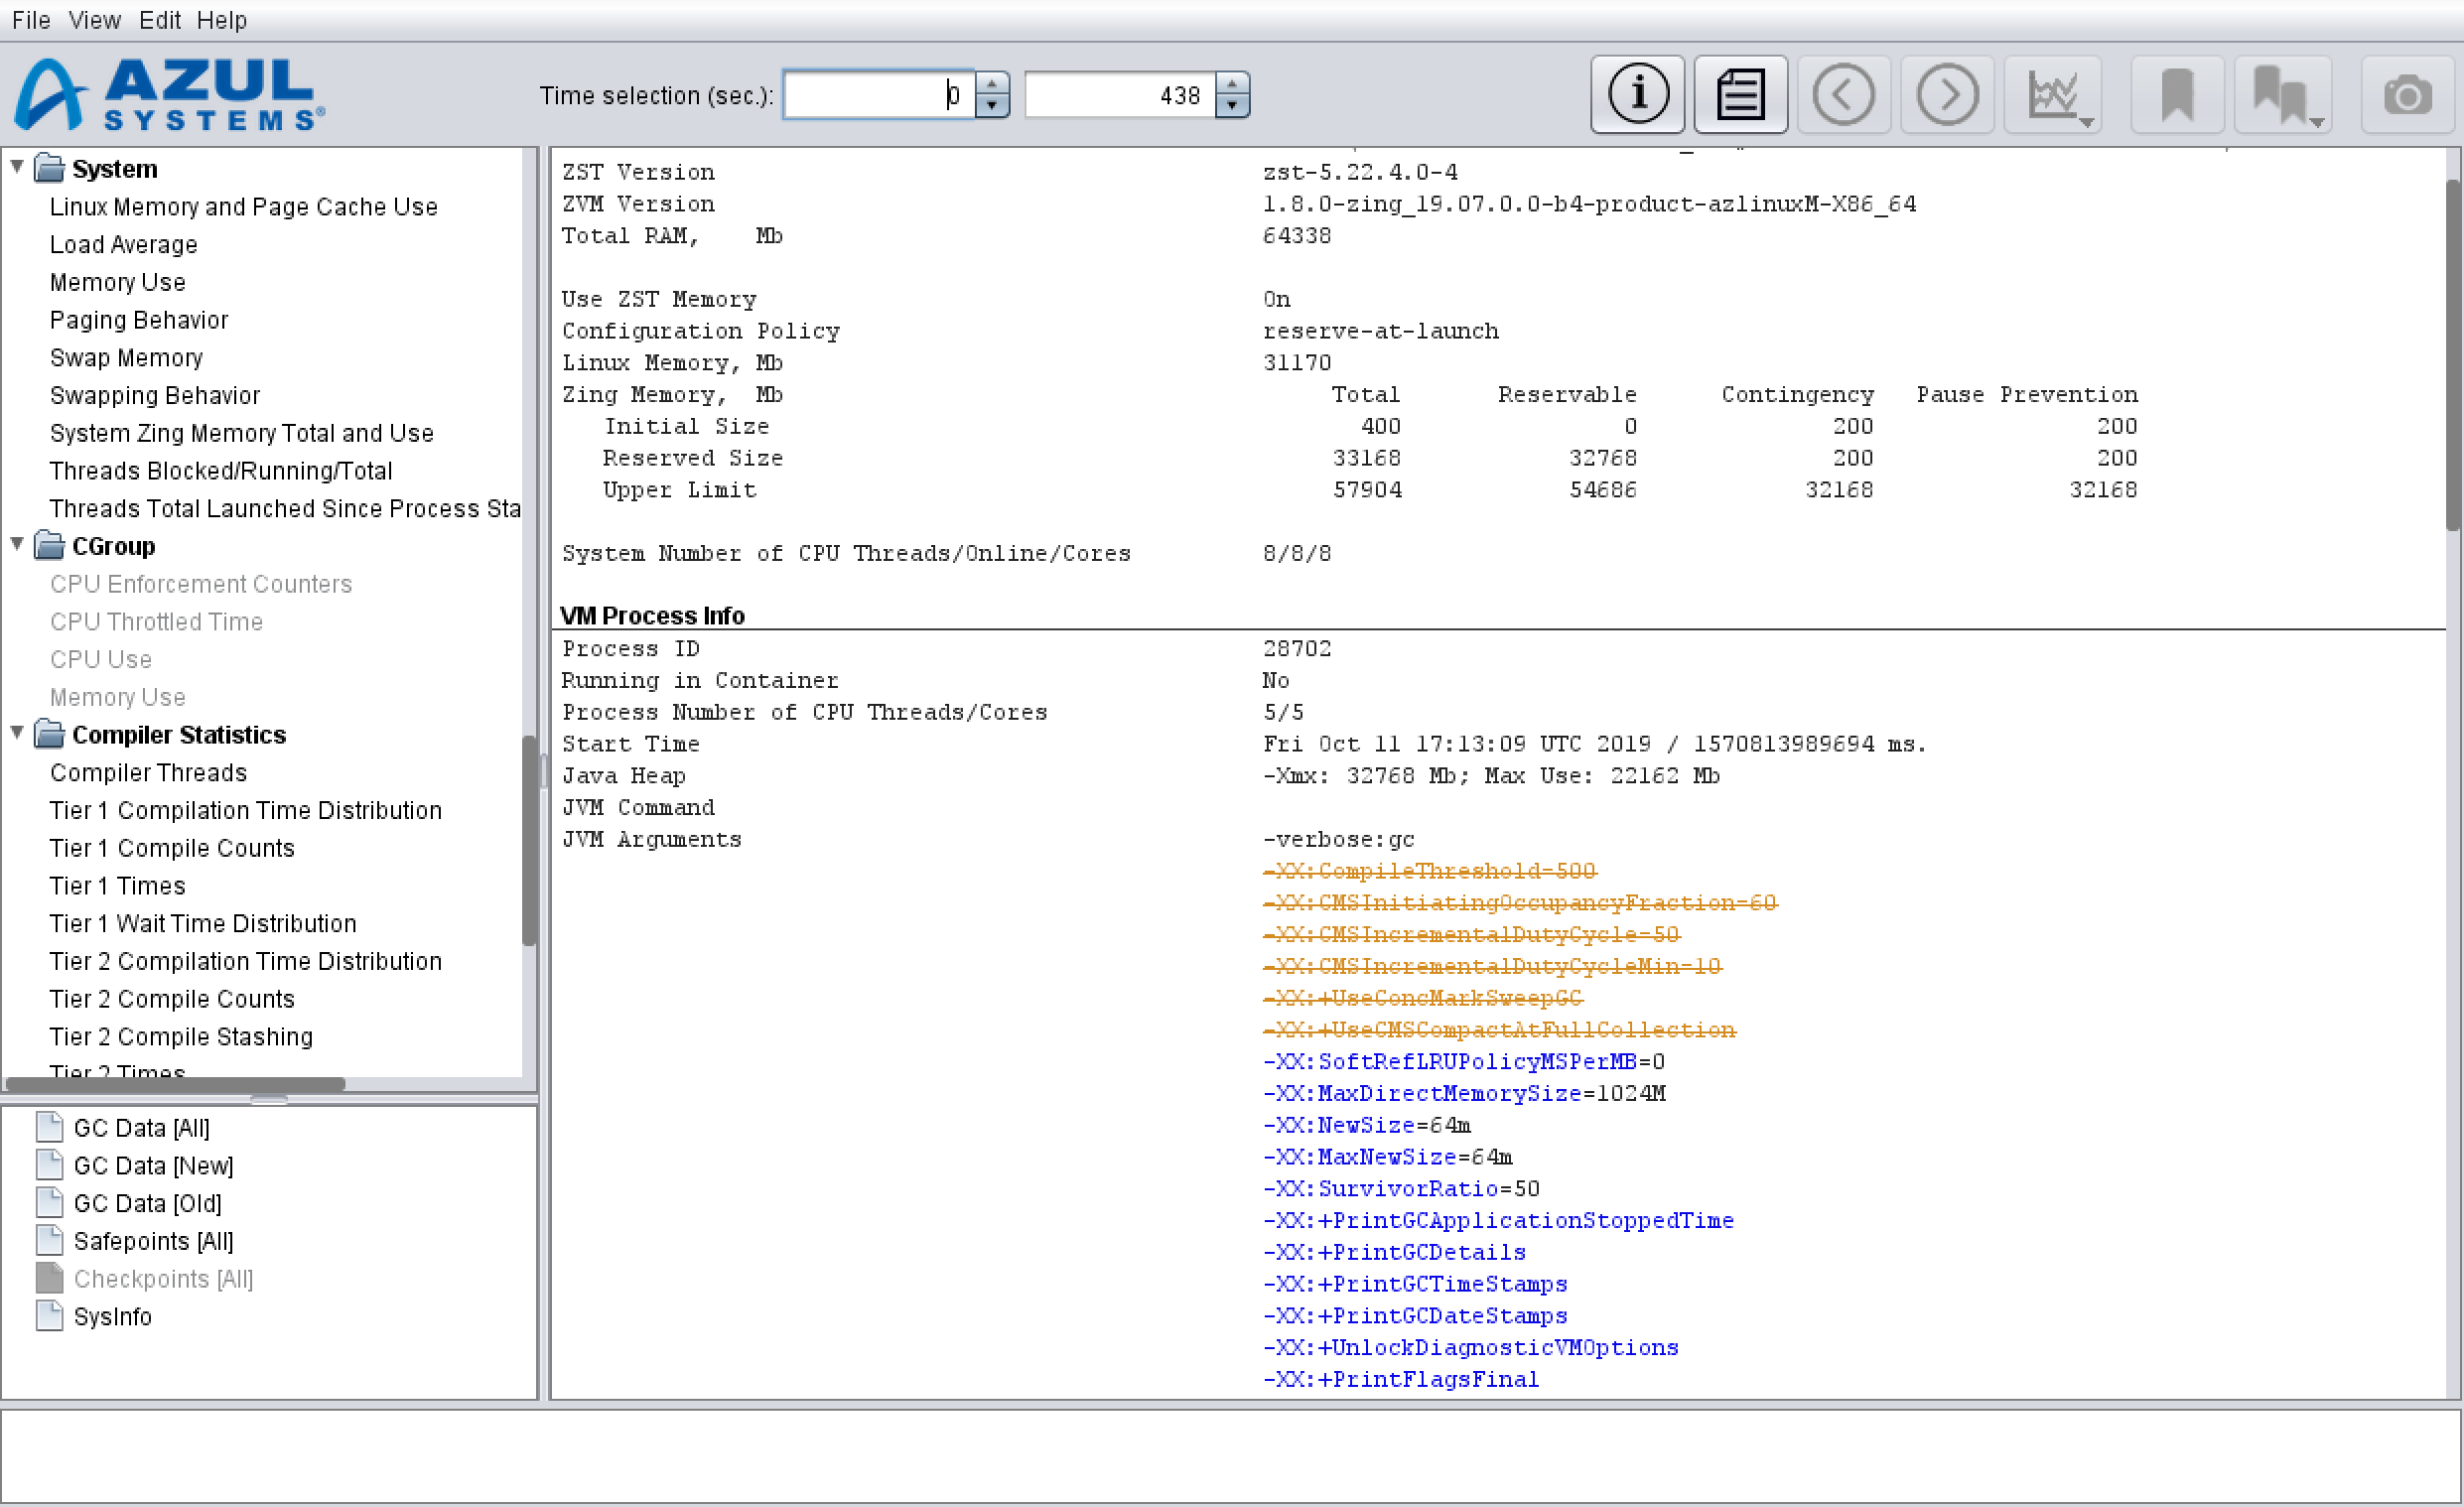
Your GC Log summary displays.

In the VM Process Info part of the log summary, hover your mouse over a JVM argument to view either the description of the option (highlighted with blue) or the note that the argument is ignored (highlighted with orange and crossed).
Using the Graphs Window
The Graphs window has groups that you can expand to view subgroups of graphs.
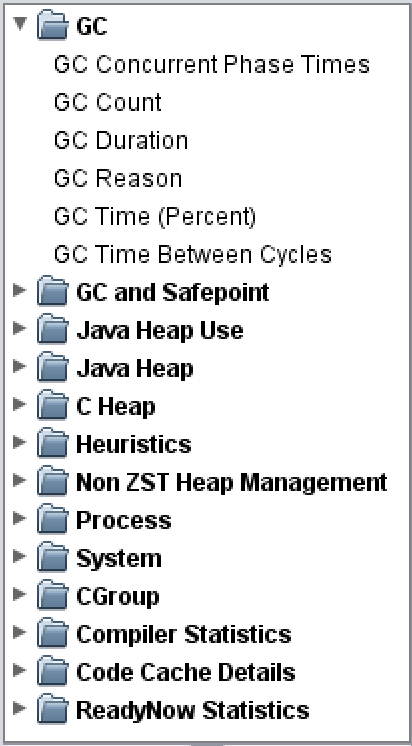
To quickly search for a graph, start typing the graph name in the Graphs window. This expands all the groups, displays the search field and the graph.
Use the Up and Down keyboard arrow keys to navigate through the graphs.
Favorite Graphs
Some charts are viewed more often than others. Favorite Charts is your way to select those frequently used charts and have them quickly accessible to you rather than scrolling through the entire list every time you want to view a specific chart.
To add a graph to your Favorite Graphs, select the graph you want to mark as a favorite and click the star in the top right corner of the graph.
To display your list of favorite graphs, navigate to View > Graphs from the toolbar, or right-click inside the list of graphs on the left side of GCLA, and select Favorite Charts.
To view all charts again, simply select All Charts from View > Graphs or from the right-click context menu.
Your favorite charts are remembered by GCLA even after you close the program.
Scratchpad
Scratchpad view allows you to view multiple charts at the same time, providing you with a convenient way of comparing several data points in a single window. Scratchpad view allows you to overlay multiple charts, giving you the ability to view multiple charts at the same time, in a single window. When you overlay multiple charts on top of each other, you can spot correlations much more quickly and easily.
As an example, overlaying a system CPU utilization chart with a spike on top of JIT compiler CPU usage and GC CPU usage can help you pinpoint whether the spike in CPU utilization is caused by the JVM (GC or a JIT compiler), the application itself, or other factors.
To turn on Scratchpad view, you can either navigate to View > Graphs and select Scratchpad, or right-click inside the list of graphs on the left side of GCLA. While scratchpad view is selected, you can select any number of charts from the list on the left to show in the data display on the right. Each chart you select is highlighted in bold with an asterisk.
To turn off scratchpad, you simply select All Charts or Favorite Charts from View > Graphs, or from the right-click context menu.
Your scratchpad saves when you select another view, but resets when you close GCLA.
Using the Table View
You can use the table view located below the Graphs window for displaying GC Log data in the tabular format for analysis.
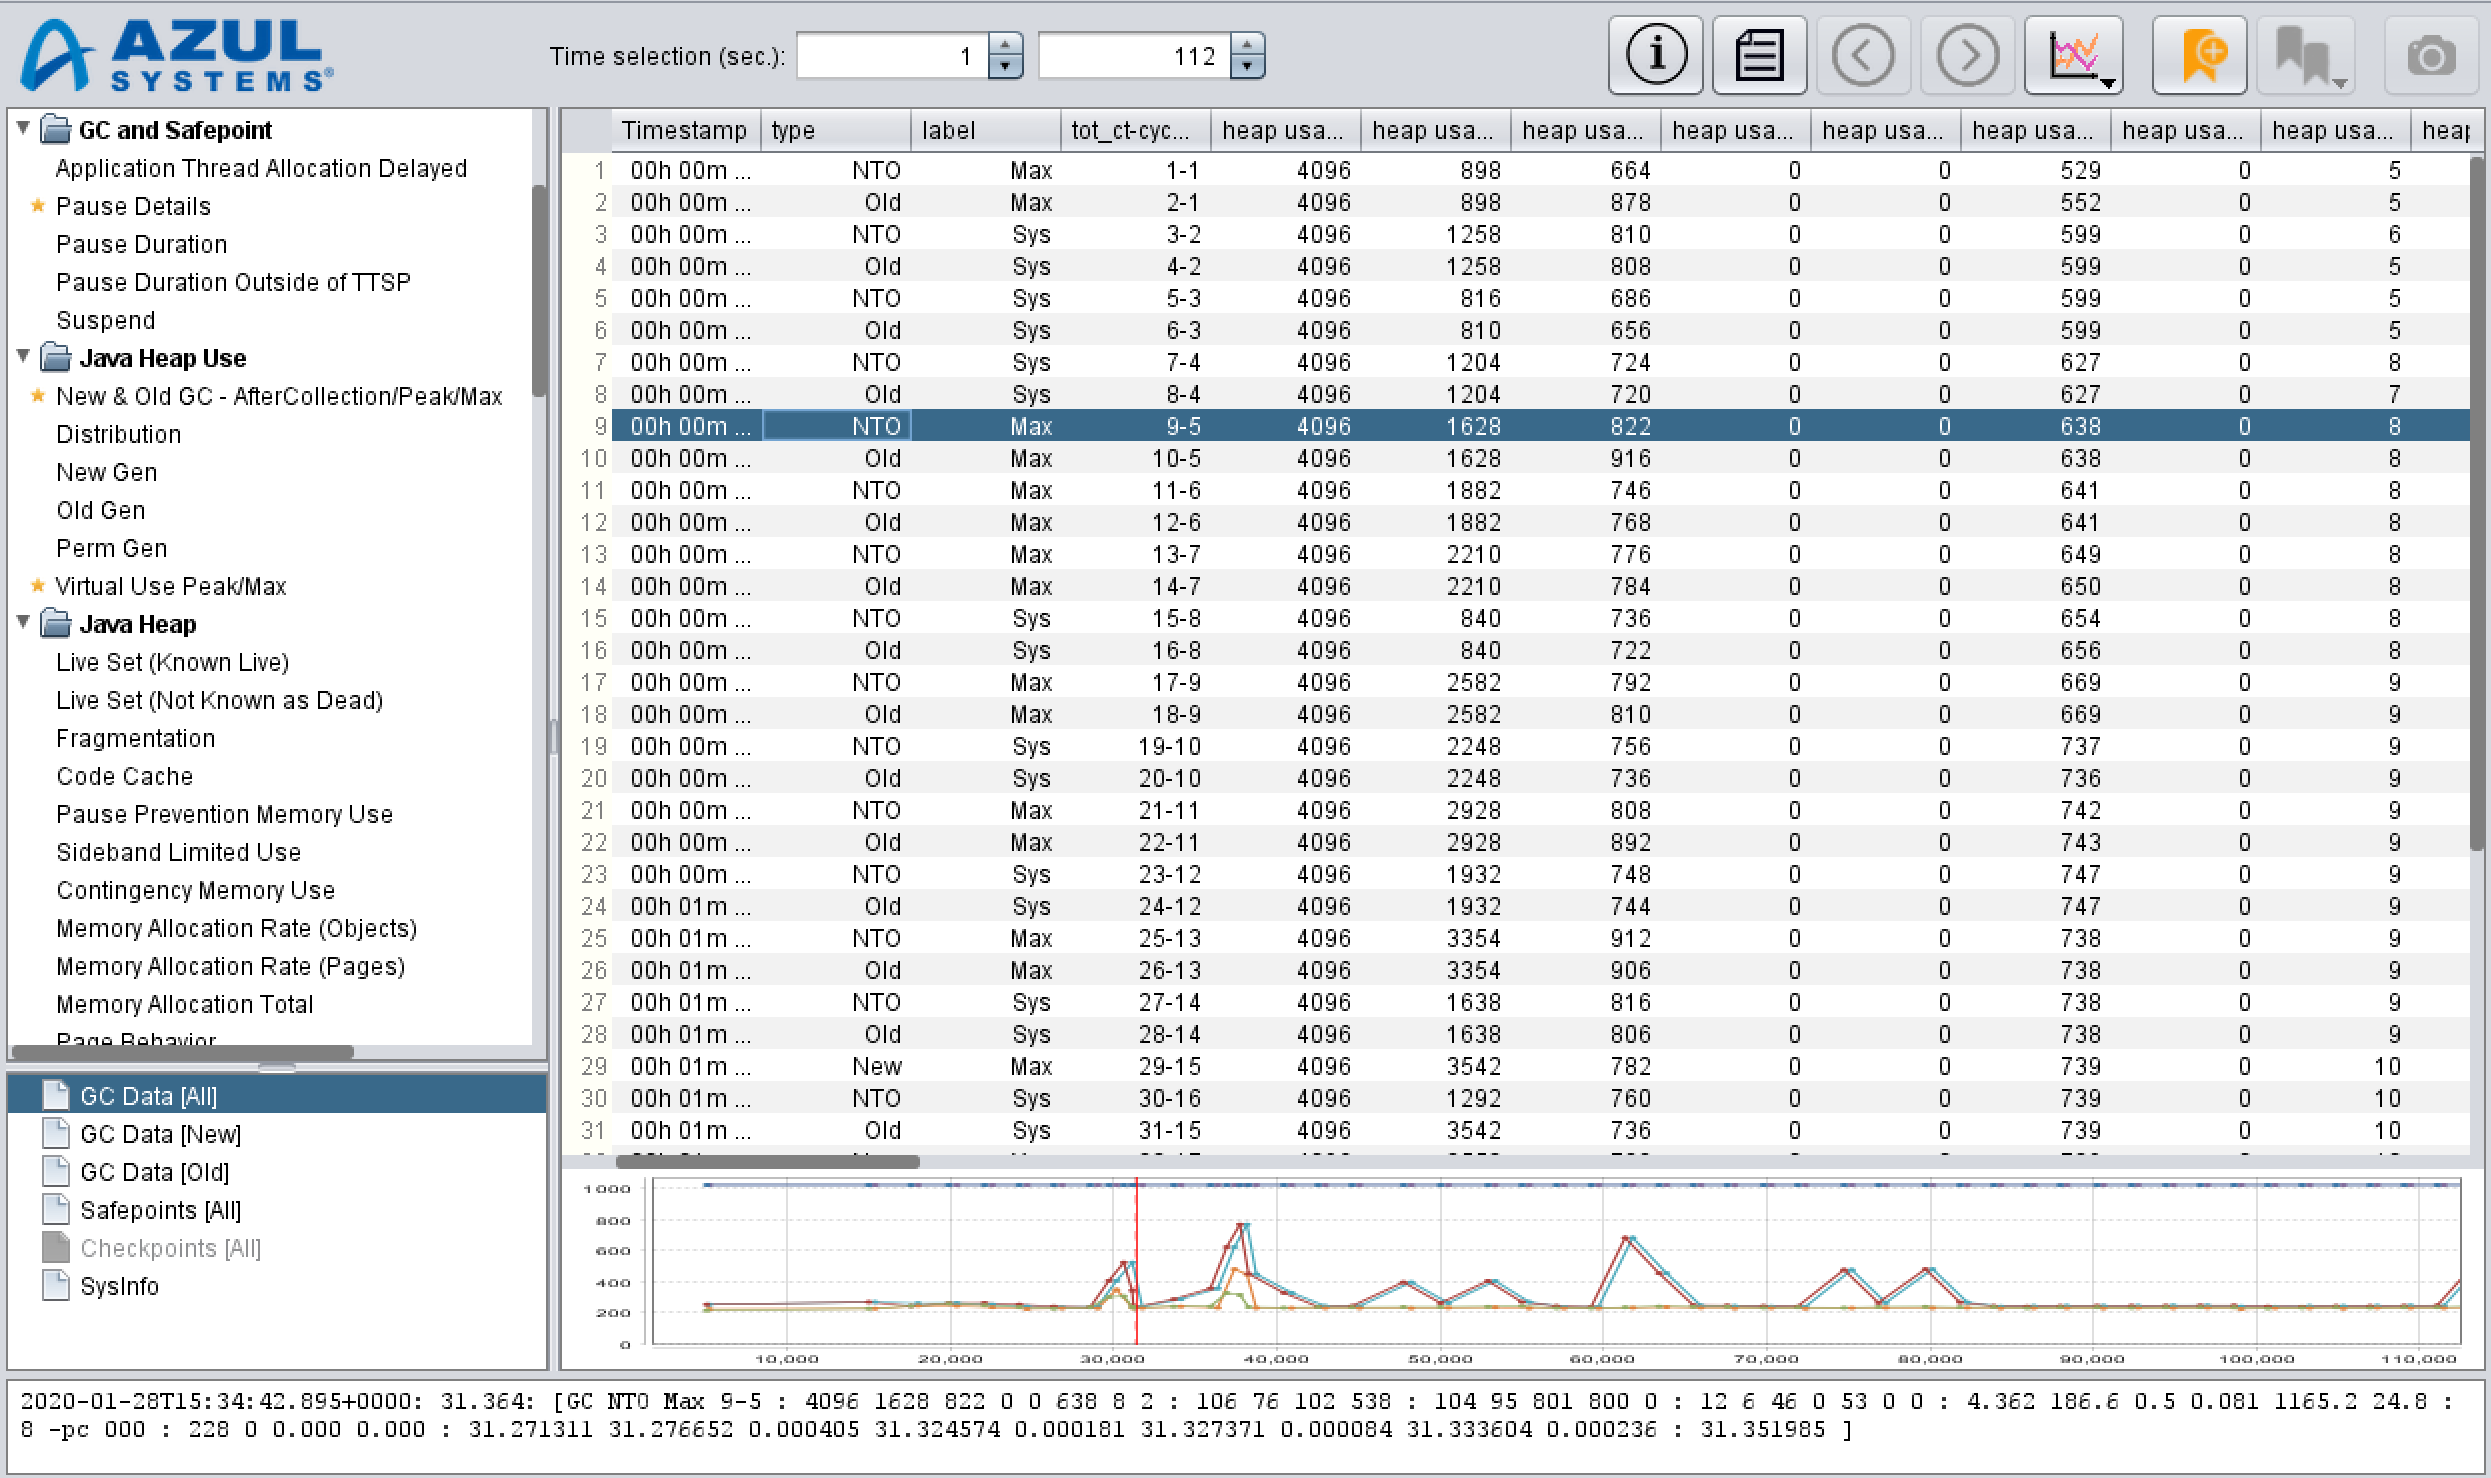
Selecting a line in the table displays the following:
-
A red vertical line connecting related points on the graph below the table
-
The data for the selected line under the minimized graph
To display detailed information about each value at the bottom of the window, hover your mouse over the value.
Using the Toolbar
The toolbar at the top of the GC Log Analyzer window contains a set of buttons you can use to perform common tasks for every selected graph.

-
Time selection (sec.): Allows to specify a time-based range in seconds to display in the graph window.
-
View GC Log Summary: Provides a cumulative and structured summary of the data collected in your GC log.
-
View GC Log: Displays a GC log in the text format, a graph in the pane below, as well as the selected line of a log at the bottom of the GC Log Analyzer window.
-
Select Previous Item: Displays the previous element in the same series in your GC log. This option becomes available after you have chosen a highlighted line in the log or a dot on a graph.
-
Select Next Item: Displays the following element in the same series in your GC log. This option becomes available after you have chosen a highlighted line in the log or a dot on a graph.
-
Select Data Series: Allows to choose what data series to display on the current graph.
-
Add Mark/Delete Mark: Allows to add or delete labeled marks applied to a log line or graph element. This option becomes available after you have chosen a log line or a graph element.
-
Select Visible Marklines: Displays or hides all labeled marks you made in the log line or graph element.
-
Export Current Graph to PNG: Saves a snapshot of the currently selected graph as a PNG image.
Switching Between the Graph and Log Views
You can switch between the Graph and Log views to work with your data.
From Graph to Log
To switch from the Graph to Log view, do either of the following:
-
select a point on the graph and click the View GC Log button in the toolbar
-
double-click on a point on the graph
This displays the Log view with a highlighted GC log line that corresponds to the point selected in the Graph view.
From Log to Graph
To switch from the Log to Graph view, select a graph in the graphs tree on the left.
Selecting Items on a Graph or in a Log
When you click on a dot of a graph to select a corresponding event, an associated GC log line displays in the bottom window, and the numerical field that the selected dot is plotted from is highlighted.

While viewing a GC log, you can click a GC log line to select it. This displays a thin red vertical bar on a preview chart to help identify the location of the selected line in the run.
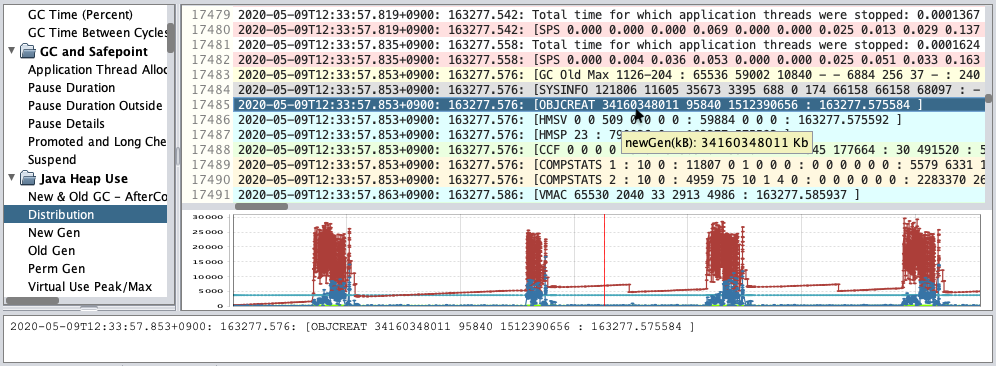
If the selected line is colored (i.e., it is one of the lines that chart data is extracted from), it is replicated in the bottom window that fits the entire line for easier analysis.
Hovering a mouse over a numerical field in either presentations of the line reveals a descriptive tooltip.
Zooming In and Out
Rubber-Band Selection
Position the pointer inside a chart, click and drag it in the direction from the top-left to the bottom-right edge of the chart. This enlarges the area selected with your pointer.
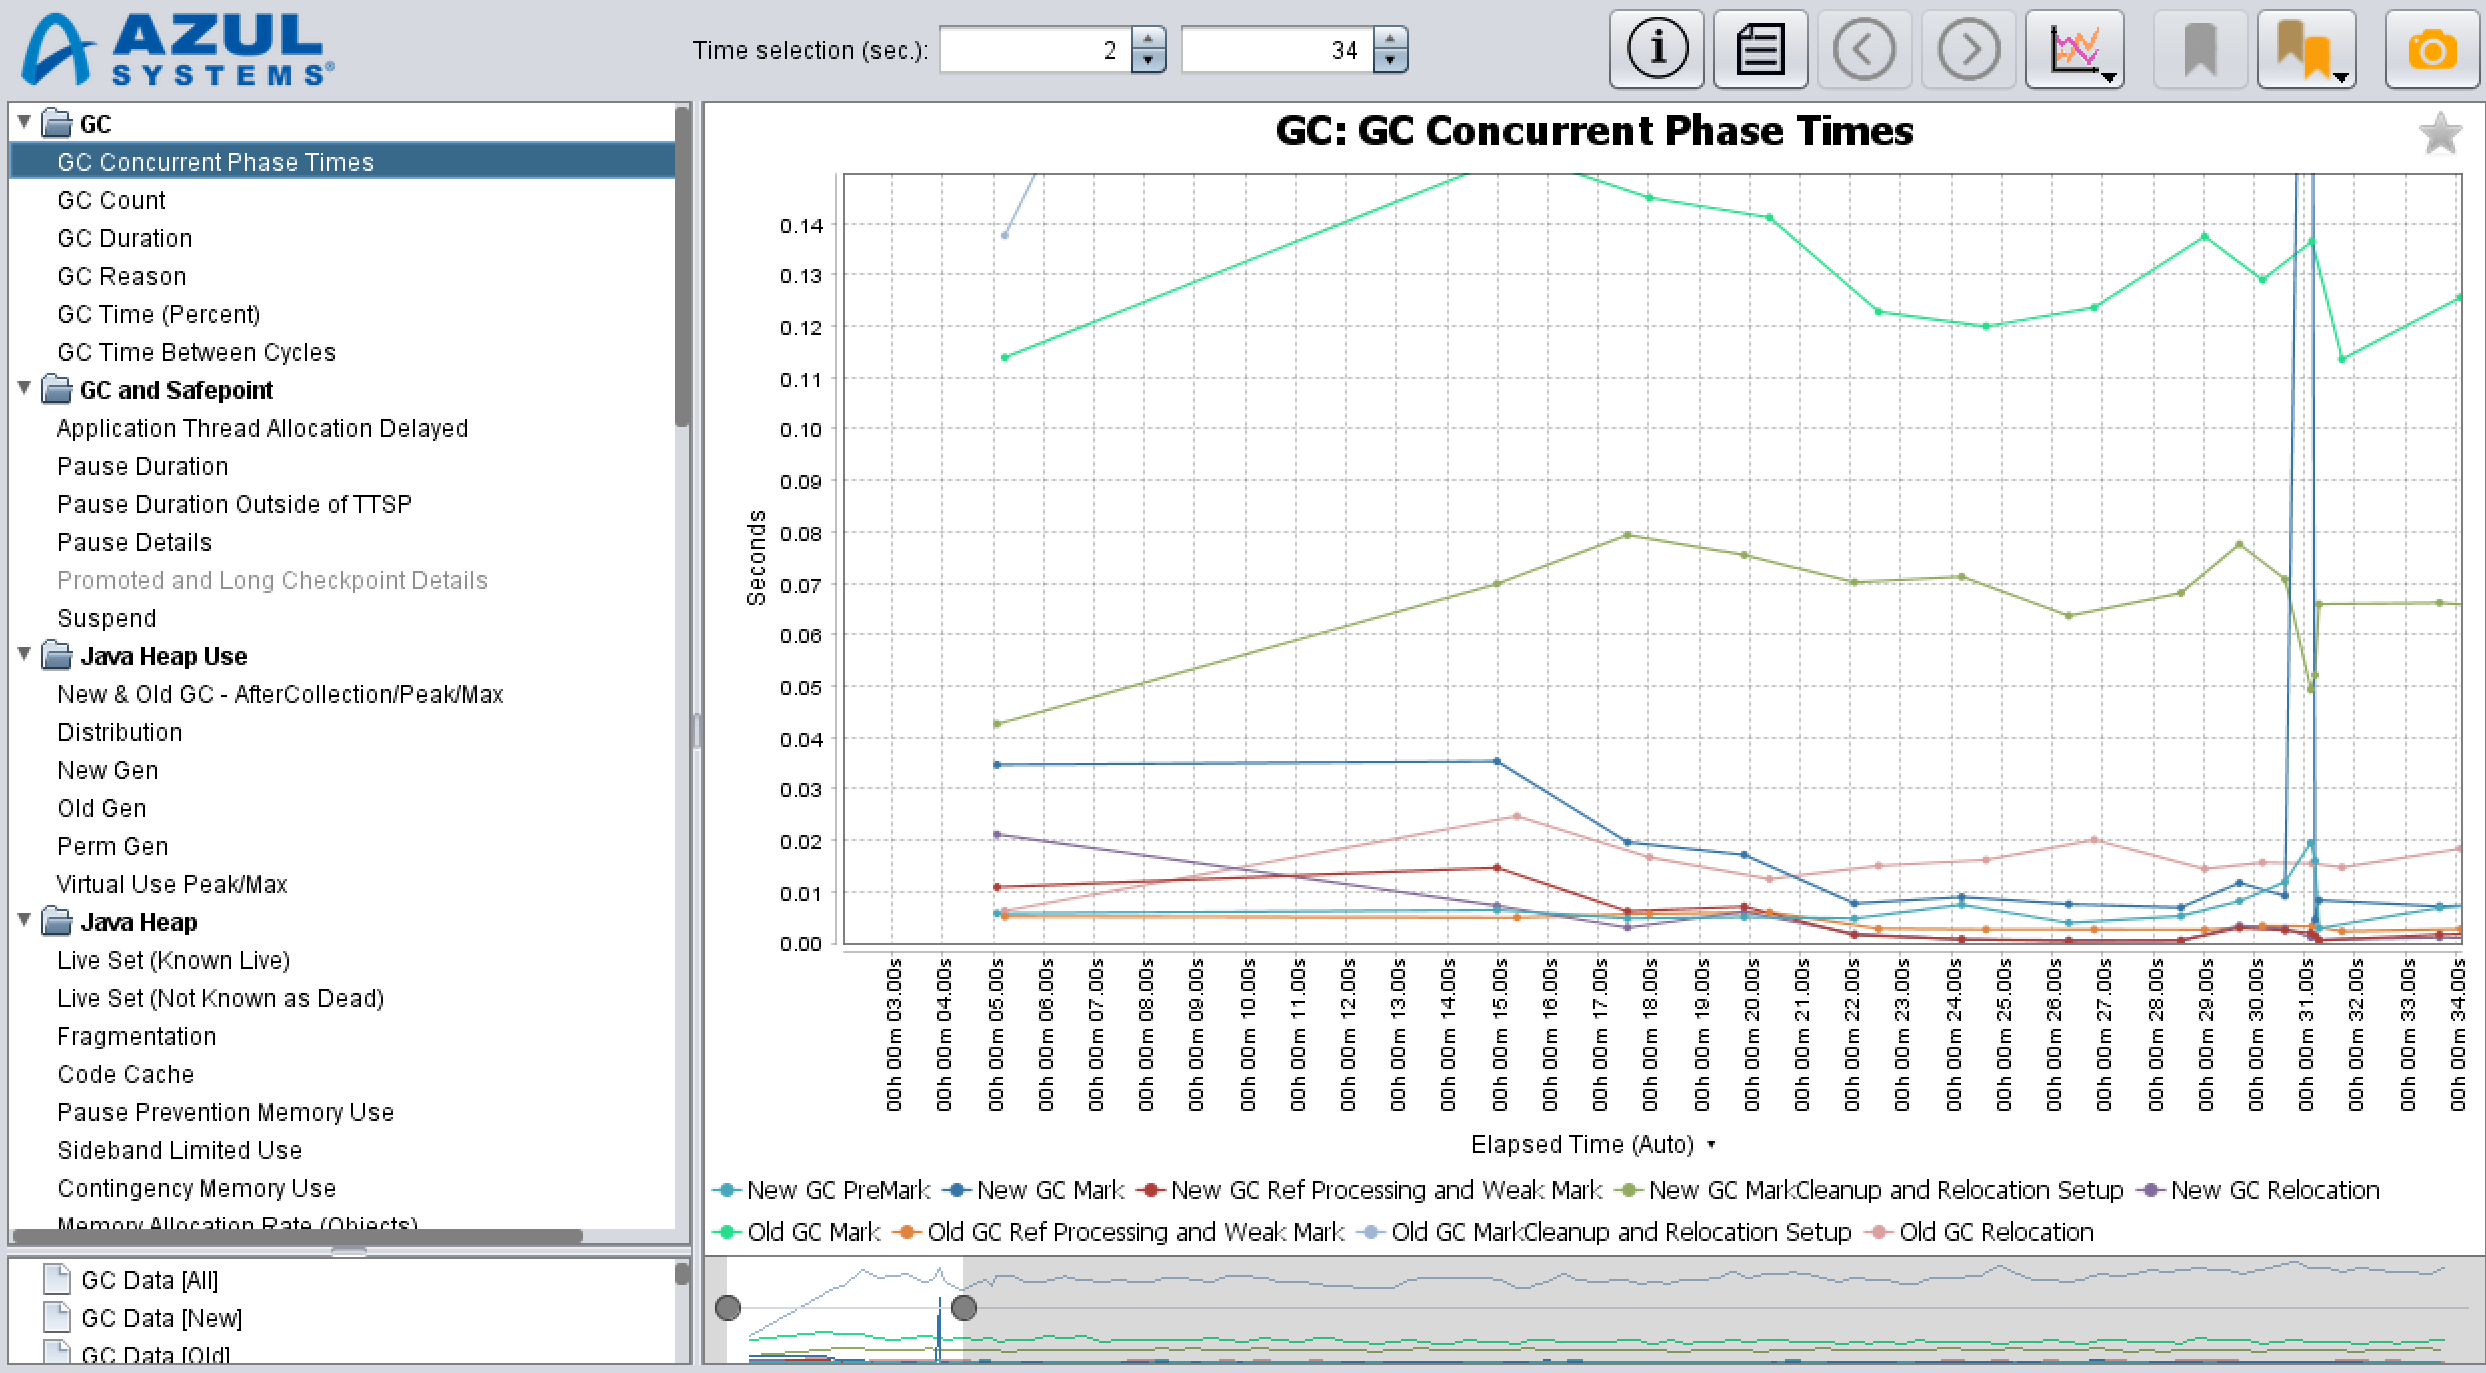
Double-click inside the enlarged area of the chart to automatically adjust the Y-axis so that all dots of all currently visible lines within the currently visible time frame display.
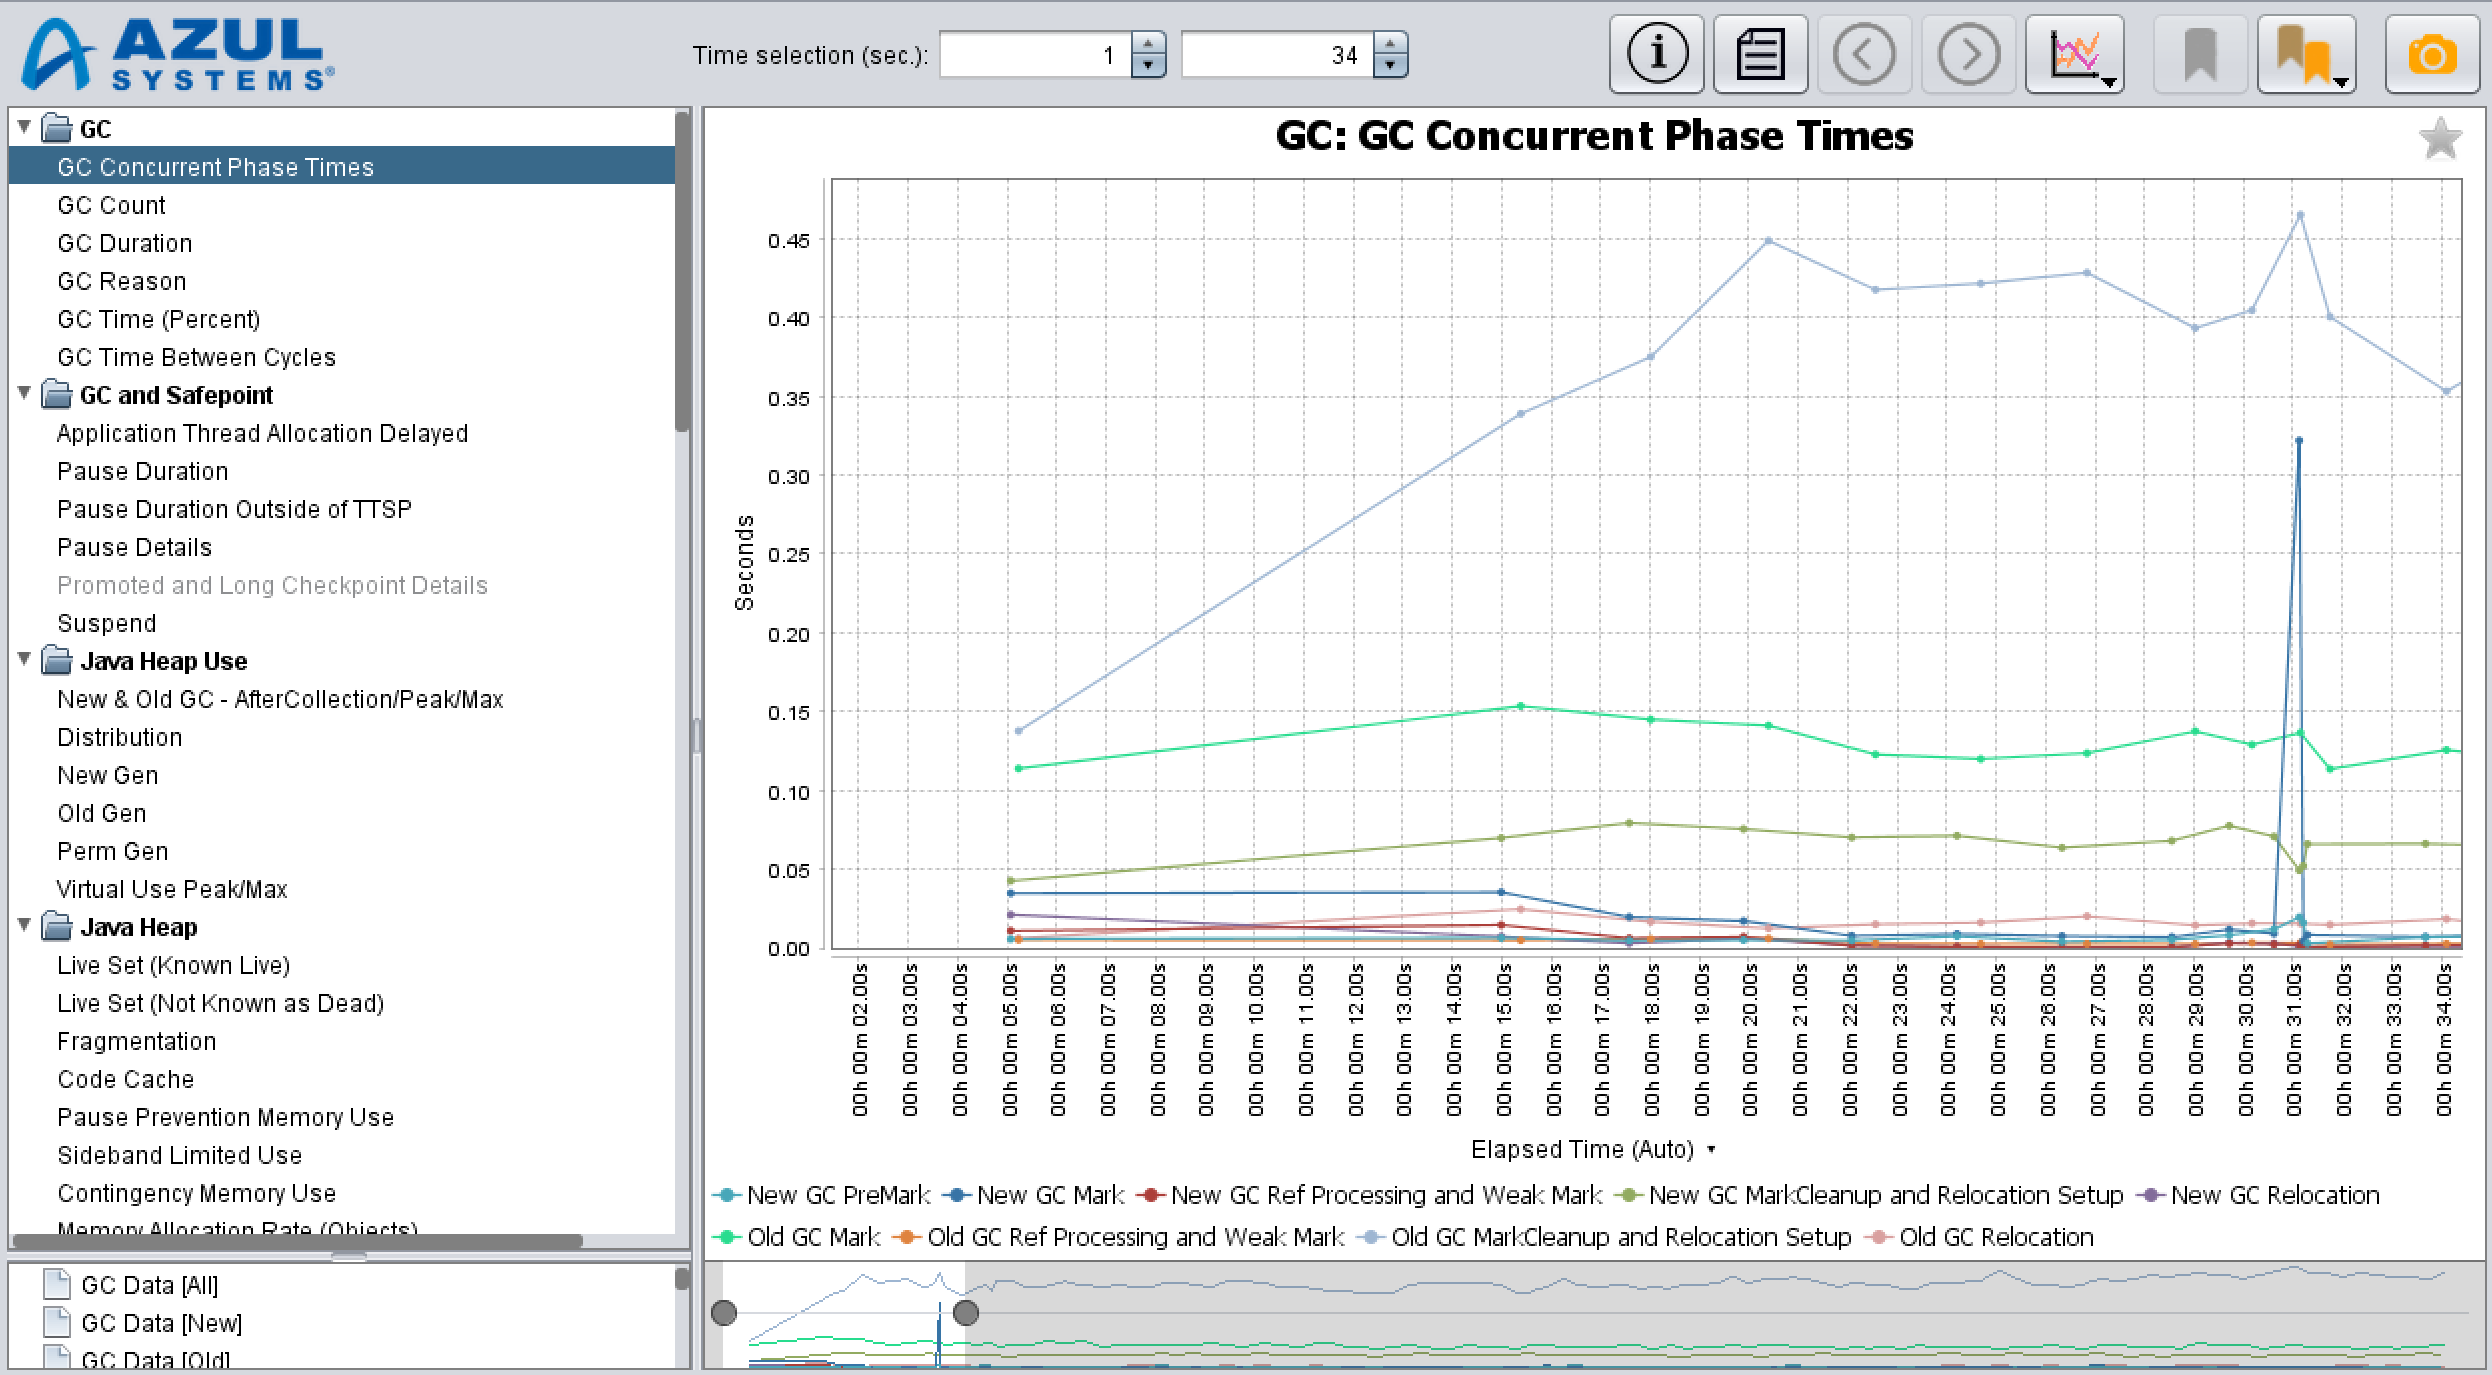
To reset zooming, click and drag your pointer in any other direction on the chart or double-click inside the selected portion of the timeline in the sliding bar.
Range Selection
To zoom in a specific time range of your graph, use a range slider below each chart to change a visible time frame. Dragging either of the slider handles represented by gray dots alters the beginning or the end of the visible time frame.
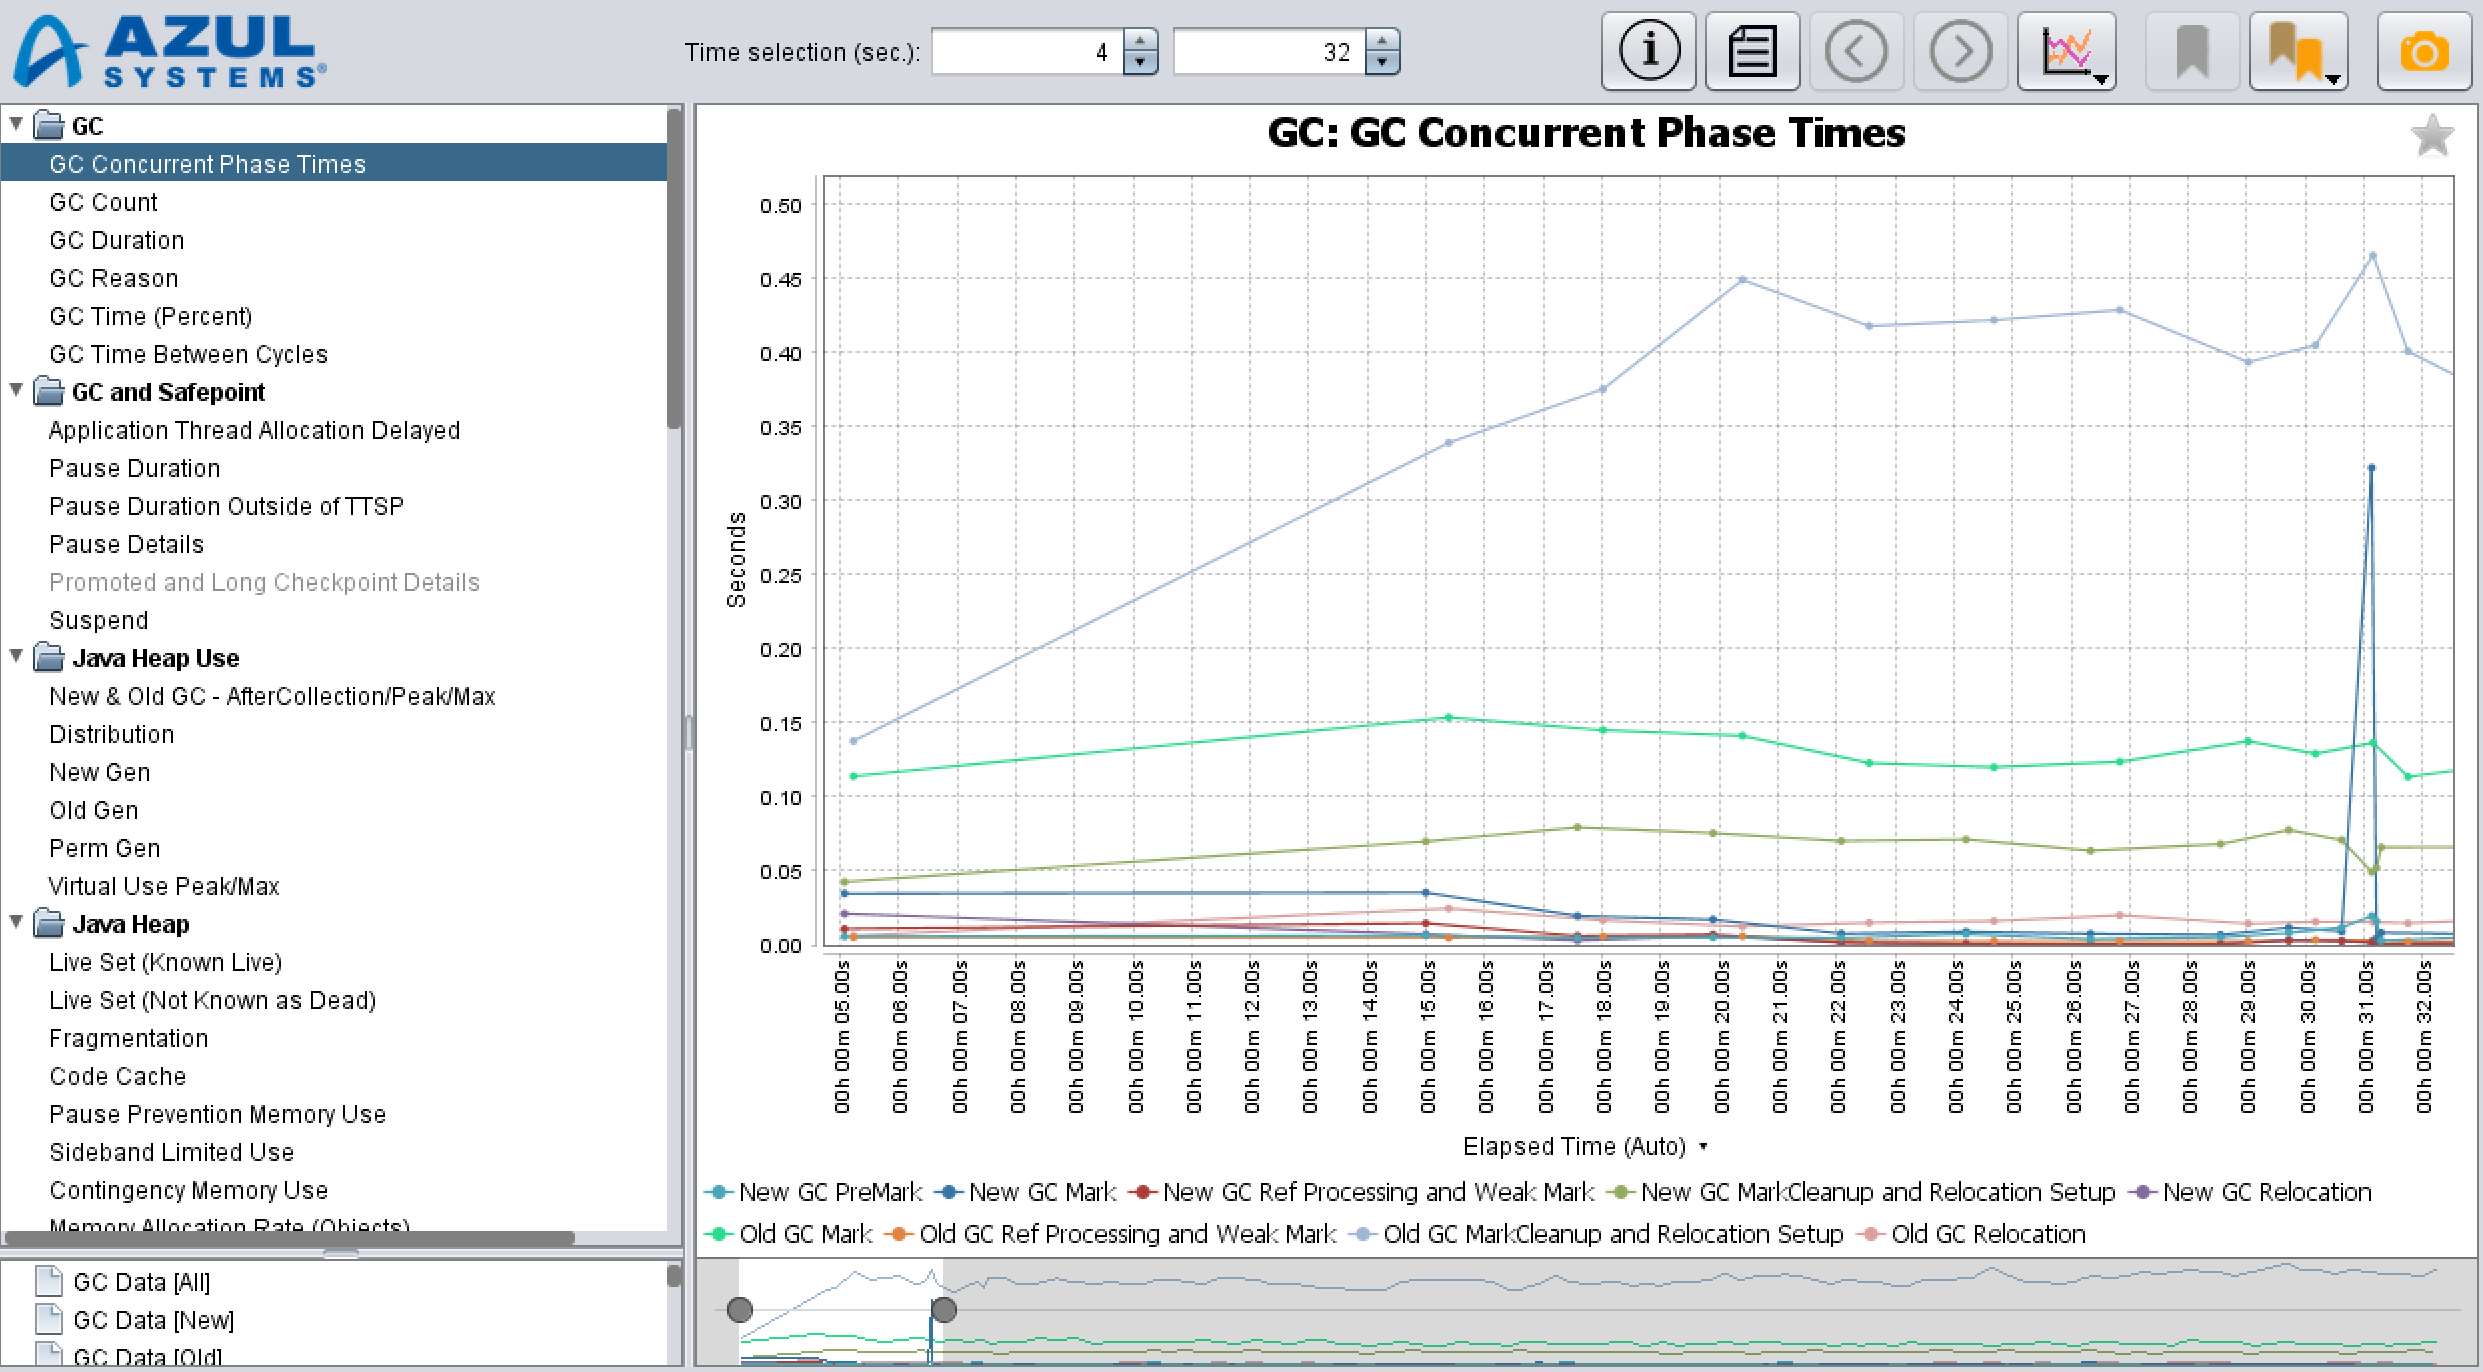
You can drag the center of the selected portion of the time line to the left or right to change the position of the enlarged time frame and keep the width of your selection.
Time Selection
To precisely set a specific time frame for viewing in a chart, specify the start and end seconds in the Time selection (sec.) fields of the toolbar.

Displaying Data in a Graph
A legend at the bottom of every graph describes the names and colors of each series of data included in the graph.

To display or hide a particular data series in the graph, toggle the items in the legend or use the Select Data Series button in the toolbar.
To display your preferred units for the time when a GC event started or time elapsed since the beginning of a GC log in the chart, select View > Time Units from the main menu or click a little upside-down black triangle above the graph legend. The GC Log Analyzer uses seconds as default time units.