Heap Analysis Basics
Table of Contents
JVM memory shortage often leads to instability and slowdown of Java applications.
Low memory errors may not show up during an application testing, but may occur later in the production environment when the Java application uptime increases and objects fill up the Java heap either due to a programmer’s mistake or due to insufficient RAM.
Eventually, the heap space shortage may lead to OutOfMemoryError since the Garbage Collector is not able to free up memory because all objects are live.
This section shows you how to create and analyze a Java heap dump using Azul Mission Control.
Creating a Heap Dump
A heap dump is a snapshot of the Java heap space with all the objects that exist in the JVM heap at a specific moment of time.
To create a heap dump, right-click the JVM node you need on the "JVM Browser" tab and click "Dump Heap". This creates a dump file dump_<connection_time>_<recording number>.hprof that is saved by default to the following locations:
-
Windows:
<usr_dir>\zmc\<zmc_version>\ -
Linux:
<usr_dir>/.zmc/<zmc_version>/ -
macOS:
/Users/<usr_dir>/.zmc/<zmc_version>/
Azul Mission Control automatically opens the newly created .hprof file and displays the analysis results in "JOverflow".
"JOverflow" is a Azul Mission Control plugin that aggregates objects with the same types of problems, calculates overhead values, and visualizes this information on charts and tables.
If you want to open an arbitrary dump file, click "File" > "Open File" on the toolbar.
Example: Seek for Memory Leaks with JOverflow
The following scenario shows how to investigate memory leaks with Azul Mission Control.
-
Create a heap dump of your Java application.
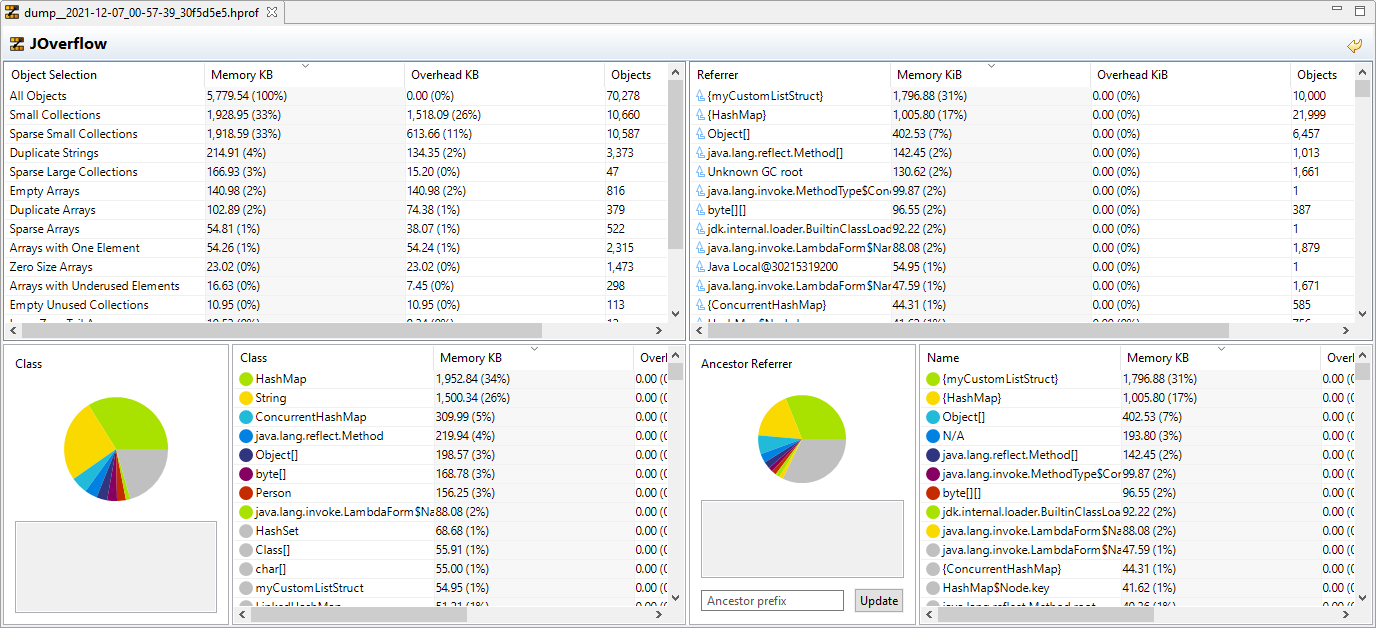
In this scenario, the heap dump has the following view:
-
Select the overhead category.
In the Object Selection table, select the entry with the highest Overhead percent. The selected category may be a cause for possible memory leaks. In this scenario, 26% of total heap space is allocated to small collections:
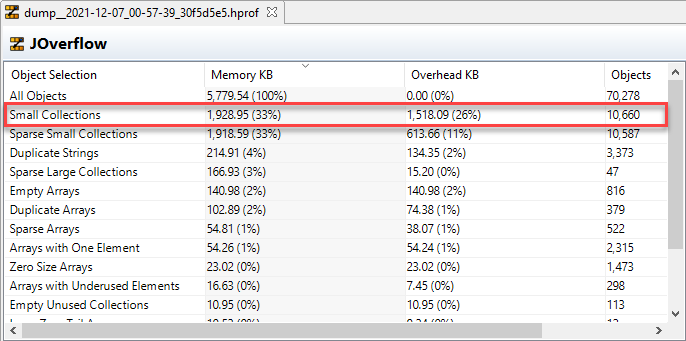
Click the Small Collections overhead category to track the potentially leaking classes.
-
Filter the Class.
In the Class section, you can view that
HashMapis on top of the list and accounts for 34% of the total heap space consumed.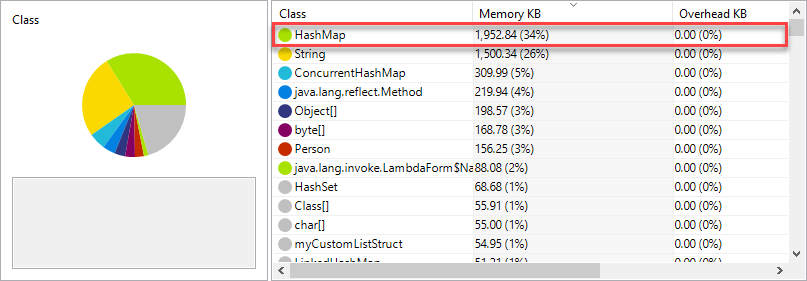
Click
HashMapand view the Referrer table to identify the source of the leaking object. -
Drill down the Referring Chain.
In the Referrer table, you can view the top-level item
mCustomListStructwhich indicates a custom Java class. An instance of this class has 10000 references to HashMap objects: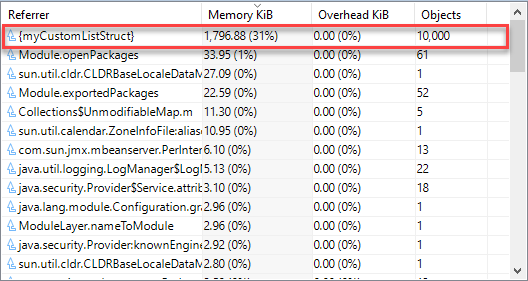
Click
mCustomListStructto expand the reference chain, and view problem objects (HashMap) at the bottom of the chain. In this scenario,mCustomListStructis the only referrer to numerous HashMaps, however, during your investigation you may observe a lot of nested referrers. You can inspectmCustomListStructusage in the source code and determine whether all the HashMaps references are required.
This section shows you how to create and analyze the heap space of a sample Java application and how to reveal possible memory leaks with JOverflow. For more information, refer to the context help within the Azul Mission Control app.