Analyzing a JFR Recording
You can analyze recordings with Azul Mission Control in the following ways:
-
Load an existing recording with "File" > "Open File…" on the Azul Mission Control toolbar to open an existing
.jfrfile. -
Drag and drop a
.jfrfile into Azul Mission Control. -
Start a recording of a running application, as described here. The recorded data is stored to a
.jfrfile. When such a recording is finished, the results are displayed.
After loading a recording, Azul Mission Control displays an automated analysis result as shown below.
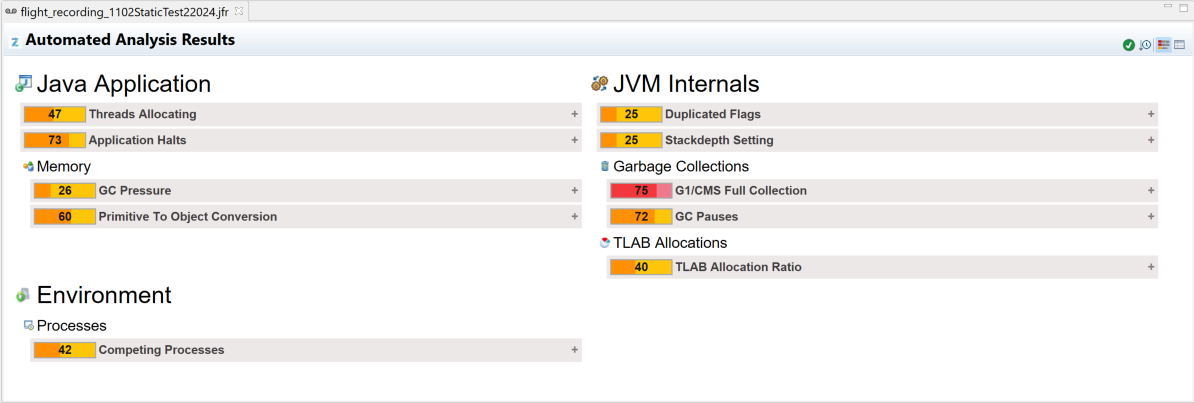
The overview screen displays recorded data split into categories. Click a node to investigate the corresponding category details.
-
Java Application: Includes data about the recorded Java program workflow: threads life cycle, I/O activity, Exceptions thrown, etc.
-
JVM Internals: Holds JVM activity metrics: Class loading, Garbage collection indices, and other events.
-
Environment: Holds data about the environment where the JVM runs.
-
Event Browser: Displays all the JVM recorded events in the form of a tree.