Configuring Prometheus and Grafana
The Optimizer Hub components are already configured to expose key metrics for scraping by Prometheus. But to be able to monitor this info in a Grafana dashboard, some additional configuration is required.
In your production systems, you likely want to use your existing Prometheus and Grafana instances to monitor Optimizer Hub. If you are just evaluating Optimizer Hub, you can use the integrated services in Optimizer Hub (available since 25.11.0). For testing and evaluation, specific instructions are provided in the installation instructions for Minikube and MicroK8s.
Using the Integrated Prometheus and Grafana
These additional steps are needed to configure the integrated Prometheus and Grafana in Optimizer Hub. They are not provided by default.
-
Create a file for the role creation:
metrics-rbac.yaml-
Copy the file from the GitHub opthub-helm-charts repository.
-
Replace the namespace in two places
namespace: opthubin the example file, or execute:sed -i 's/opthub$/my-opthub/g' ~/my-opthub/metrics-rbac.yaml -
If you create your service accounts separately, you need to match these names with the ones in this file.
-
Apply these roles:
kubectl apply -f ~/my-opthub/metrics-rbac.yaml
-
-
Create a file with the monitoring configuration:
values-monitoring.yaml-
Copy the file from the GitHub opthub-helm-charts repository.
-
If you created your own service account, update this value in the file:
name: metrics-server.
-
-
Make sure you have the Kubernetes State Metrics service running.
-
Example output:
$ kubectl get deployments --all-namespaces | grep kube-state-metrics monitoring kube-state-metrics 1/1 1 1 2y27d $ kubectl get services --all-namespaces | grep kube-state-metrics kube-state-metrics ClusterIP 172.20.61.221 <none> 8080/TCP 2y27d -
If not available yet, install it with:
 helm install kube-state-metrics \
    oci://ghcr.io/prometheus-community/charts/kube-state-metrics
-
Using Your Own Prometheus and Grafana
Use the following instructions to configure external Prometheus and Grafana instances in a production environment.
Prometheus Configuration Instructions
Optimizer Hub components expose their metrics on HTTP endpoints in a format compatible with Prometheus. Annotations are in place in the Helm chart with the details of the endpoint for every component. For example:
 annotations:
    prometheus.io/scrape: "true"
    prometheus.io/port: "8080"
    prometheus.io/path: "/q/metrics"
The following snippet is an example for the Prometheus configuration to scrape the metrics based on the above annotations:
 # Example scrape config for pods
#
# The relabeling allows the actual pod scrape endpoint to be configured via the
# following annotations:
#
# * `prometheus.io/scrape`: Only scrape pods that have a value of `true`
# * `prometheus.io/path`: If the metrics path is not `/metrics` override this.
# * `prometheus.io/port`: Scrape the pod on the indicated port instead of the
# pod's declared ports (default is a port-free target if none are declared).
- job_name: 'kubernetes-pods'
  kubernetes_sd_configs:
  - role: pod

  relabel_configs:
  - source_labels: [__meta_kubernetes_pod_annotation_prometheus_io_scrape]
    action: keep
    regex: true
  - source_labels: [__meta_kubernetes_pod_annotation_prometheus_io_path]
    action: replace
    target_label: __metrics_path__
    regex: (.+)
  - source_labels: [__address__, __meta_kubernetes_pod_annotation_prometheus_io_port]
    action: replace
    regex: ([^:]+)(?::\d+)?;(\d+)
    replacement: $1:$2
    target_label: __address__
  # mapping of labels, this handles the `app` label
  - action: labelmap
    regex: __meta_kubernetes_pod_label_(.+)
  - source_labels: [__meta_kubernetes_namespace]
    action: replace
    target_label: kubernetes_namespace
  - source_labels: [__meta_kubernetes_pod_name]
    action: replace
    target_label: kubernetes_pod_name
  metric_relabel_configs:
  - source_labels:
      - namespace
    action: replace
    regex: (.+)
    target_label: kubernetes_namespace
Grafana Configuration Instructions
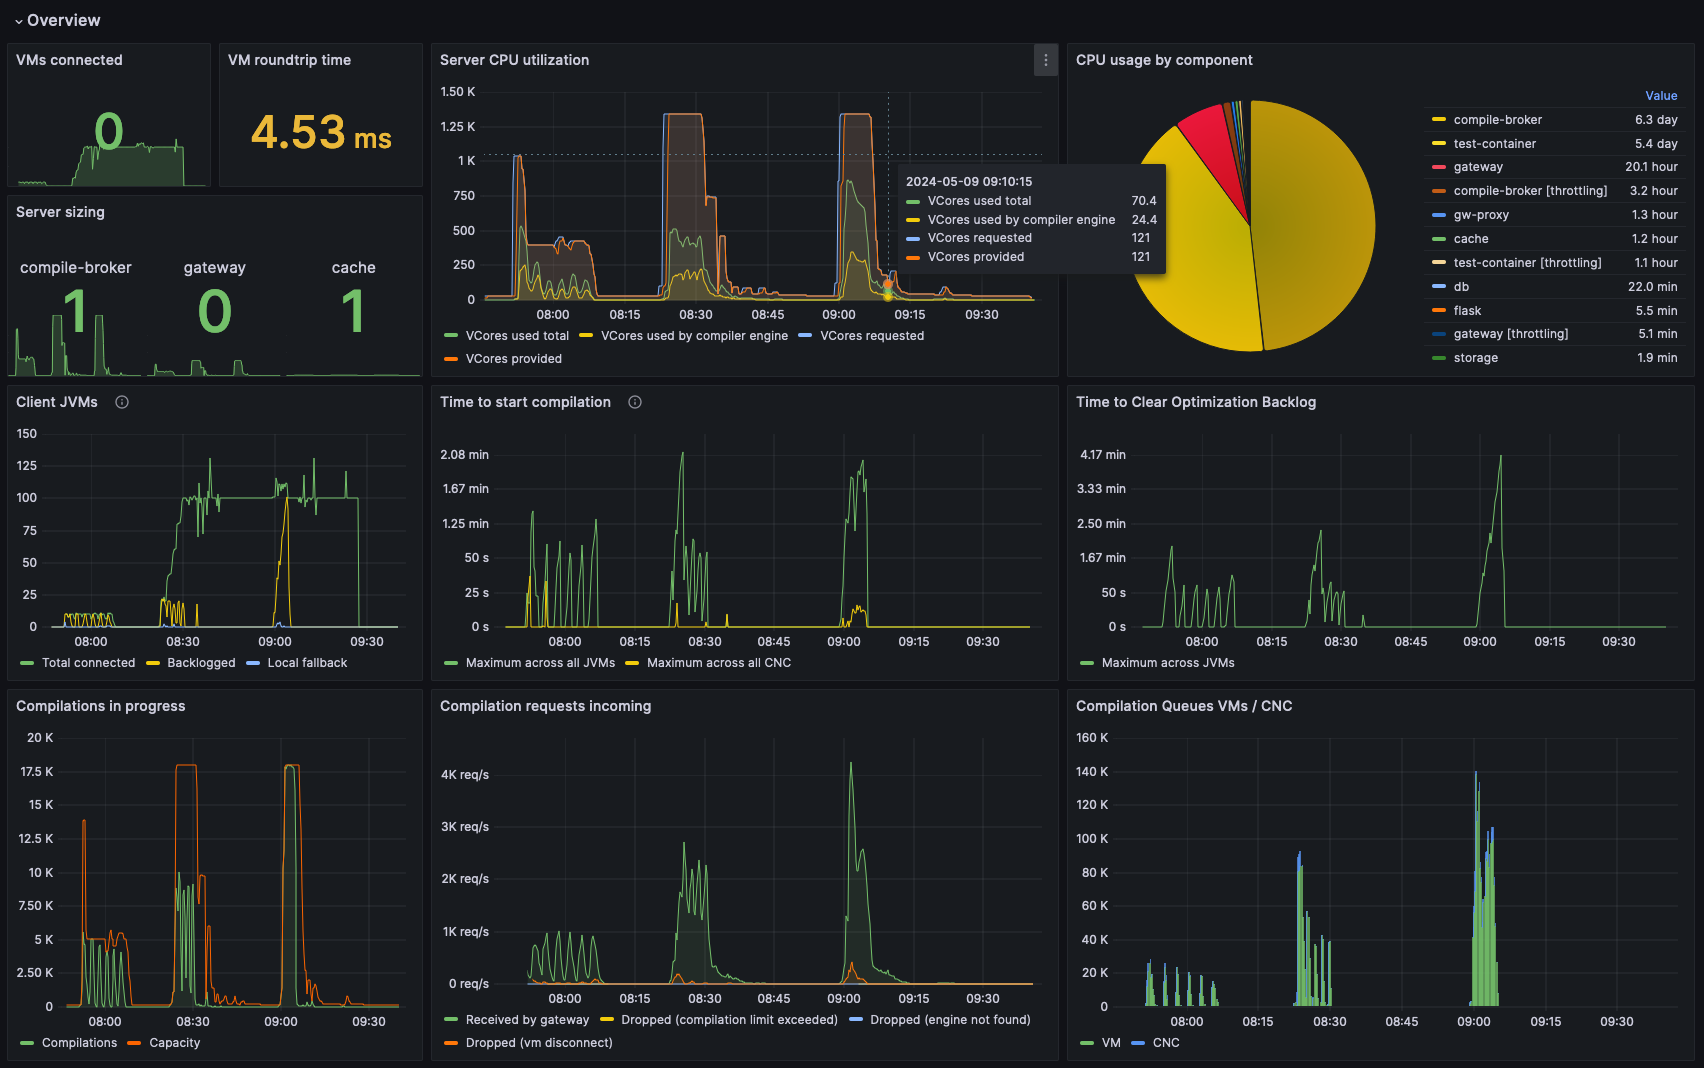
Once Prometheus is available and collection data from the Optimizer Hub Components, a dashboard can be added. In the GitHub opthub-helm-charts repository > config-files > grafana, you can find a Grafana configuration file.
This dashboard expects the following labels to be attached to all application metrics, refering to the Prometheus configuration above:
-
cluster_id: The identifier of the Kubernetes cluster on which Optimizer Hub is installed. This allows you to switch between Optimizer Hub instances in different clusters. -
kubernetes_namespace: The Kubernetes namespace on which Optimizer Hub is installed. This setting allows you to switch between Optimizer Hub instances in different namespaces of the same cluster. -
kubernetes_pod_name: The Kubernetes pod name. -
app: The value of theapplabel on the pod, which is provided by thelabelmapaction from the example Prometheus configuration mentioned below.
You need to manually edit the dashboard file if these labels are named differently in your environment.
The dashboard also relies on some infrastructure metrics from Kubernetes and cAdvisor, such as kube_pod_container_resource_requests and container_cpu_usage_seconds_total.