Using the Grafana Dashboard
Table of Contents
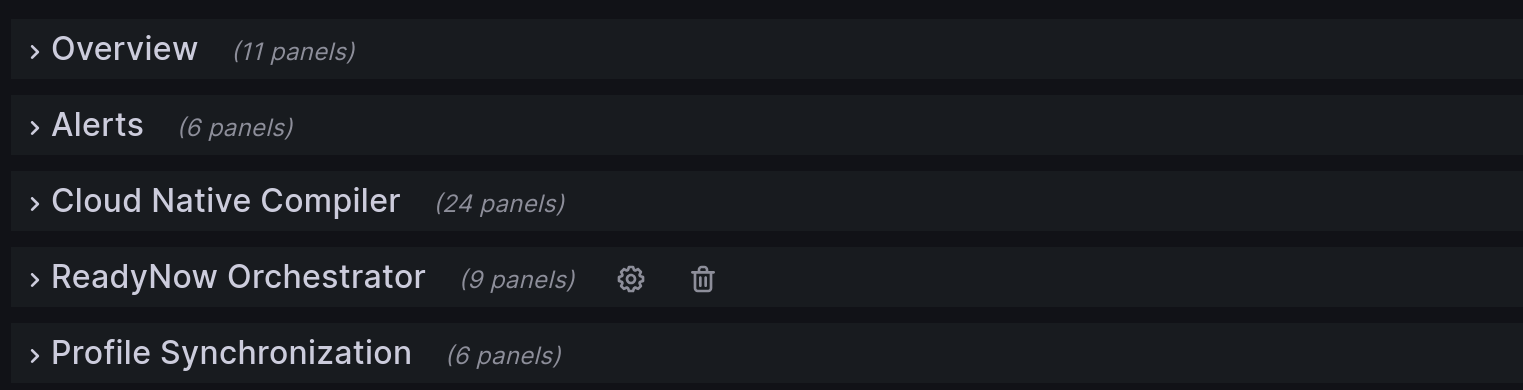
A Grafana dashboard is available after it has been configured, to understand how your Optimizer Hub instance is performing. This dashboard is divided into several sections. The most important sections from user-perspective are described here. The other sections are more oriented towards maintaining and troubleshooting of the installation.
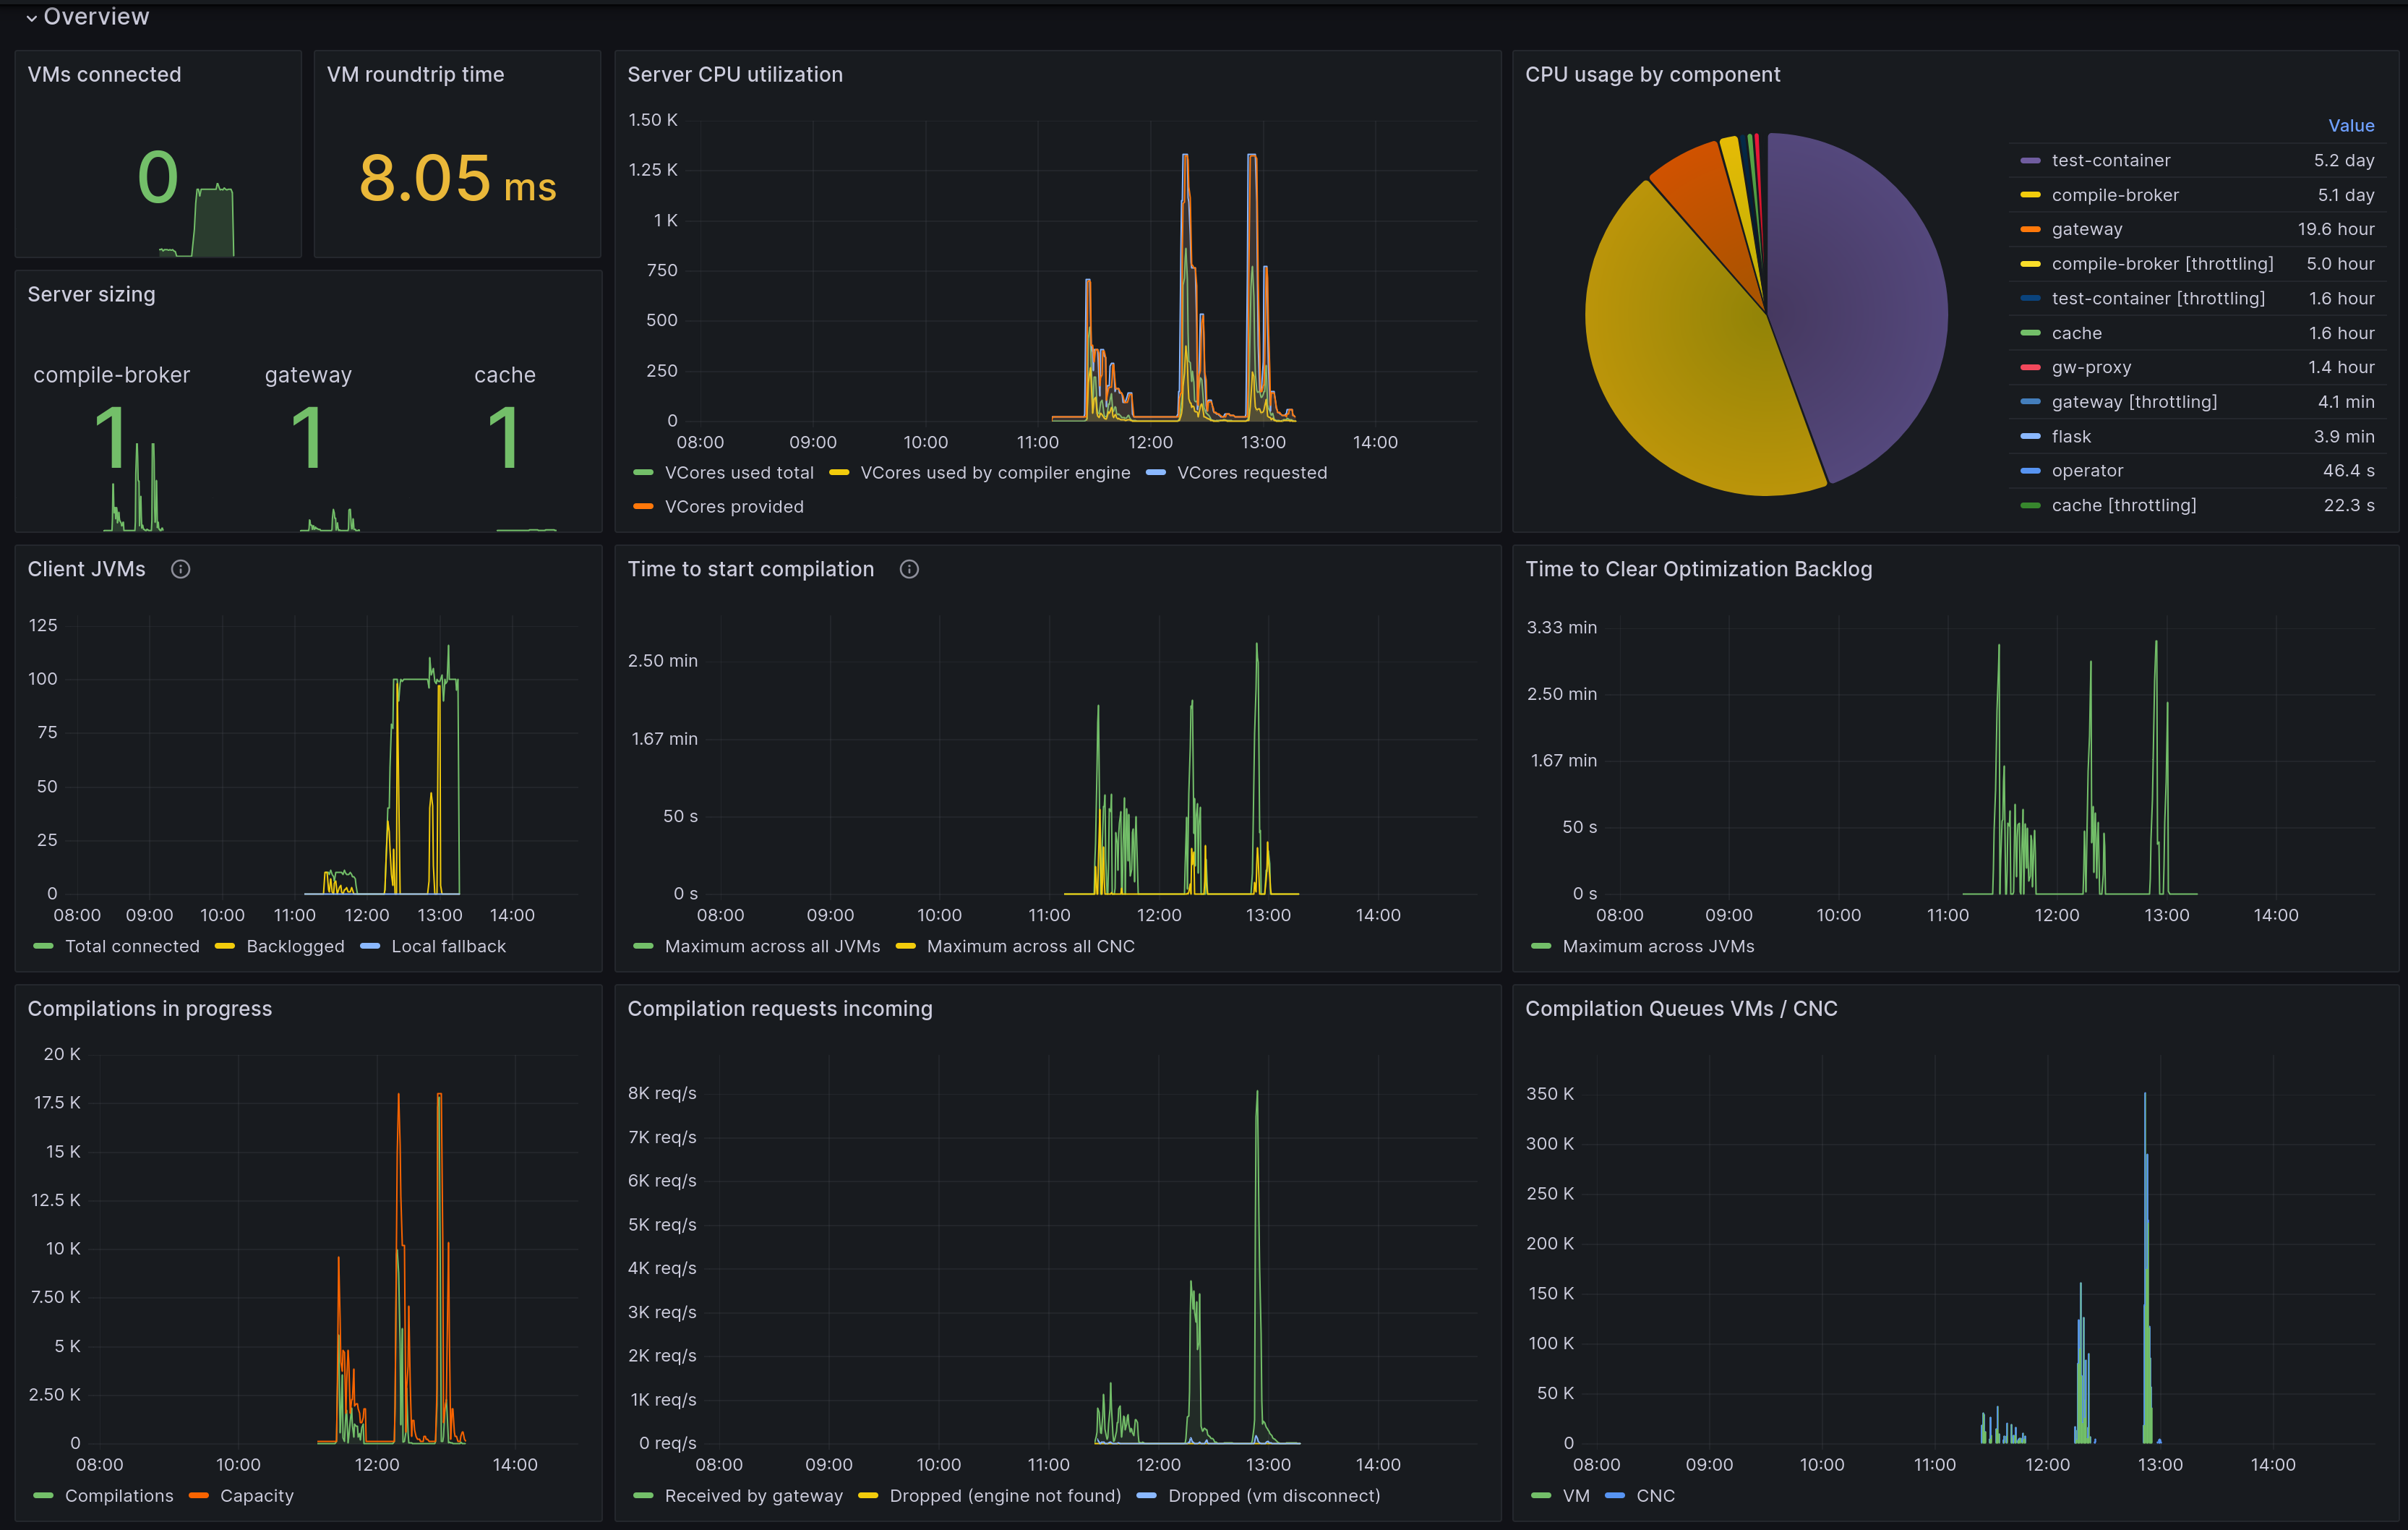
Overview
Provides a high-level view of the Optimizer Hub instance:
-
The number of running Optimizer Hub components.
-
The number of connected JVMs, with basic overview (in local fallback, backlogged,…)
-
Basic metrics about compilations, with "Time to clear optimization backlog" as the most important value to monitor.
Cloud Native Compiler
Monitoring of the Cloud Native Compiler feature. This is applicable for JVMs using the Cloud Native Compiler.

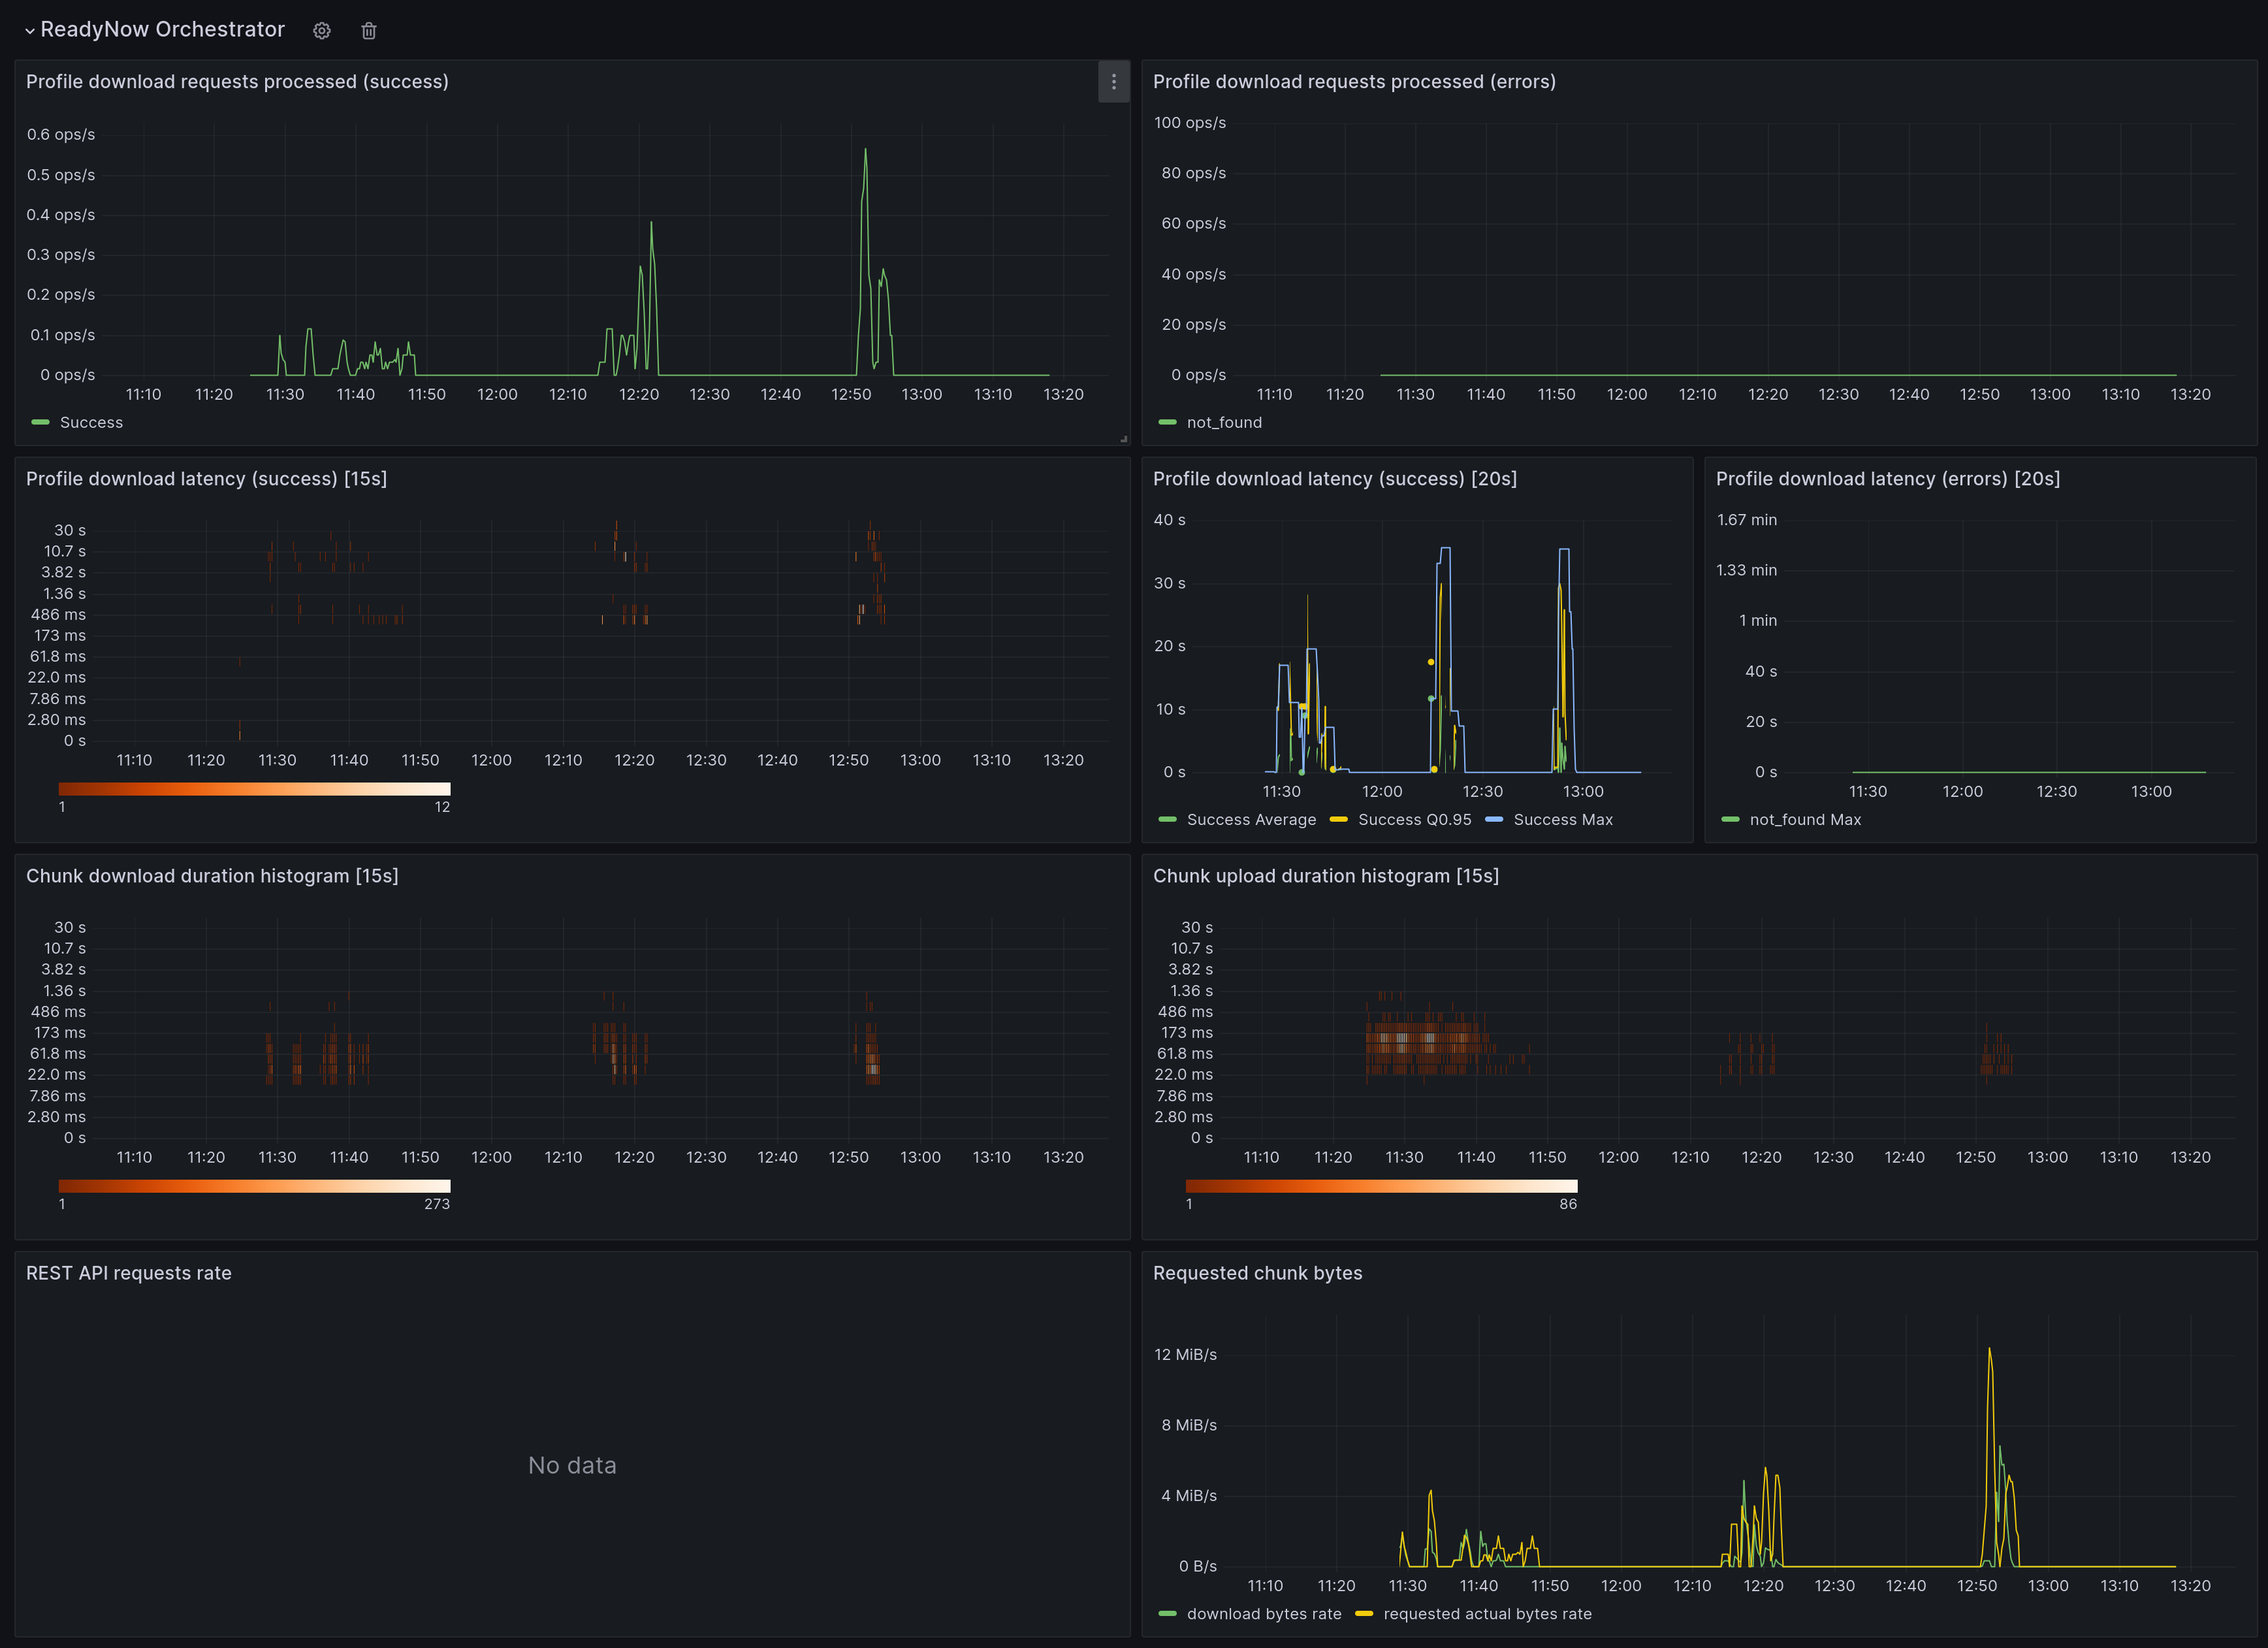
ReadyNow Orchestrator
Monitoring of the ReadyNow Orchestrator feature. This is applicable for JVMs using Optimizer Hub ReadyNow Orchestrator.
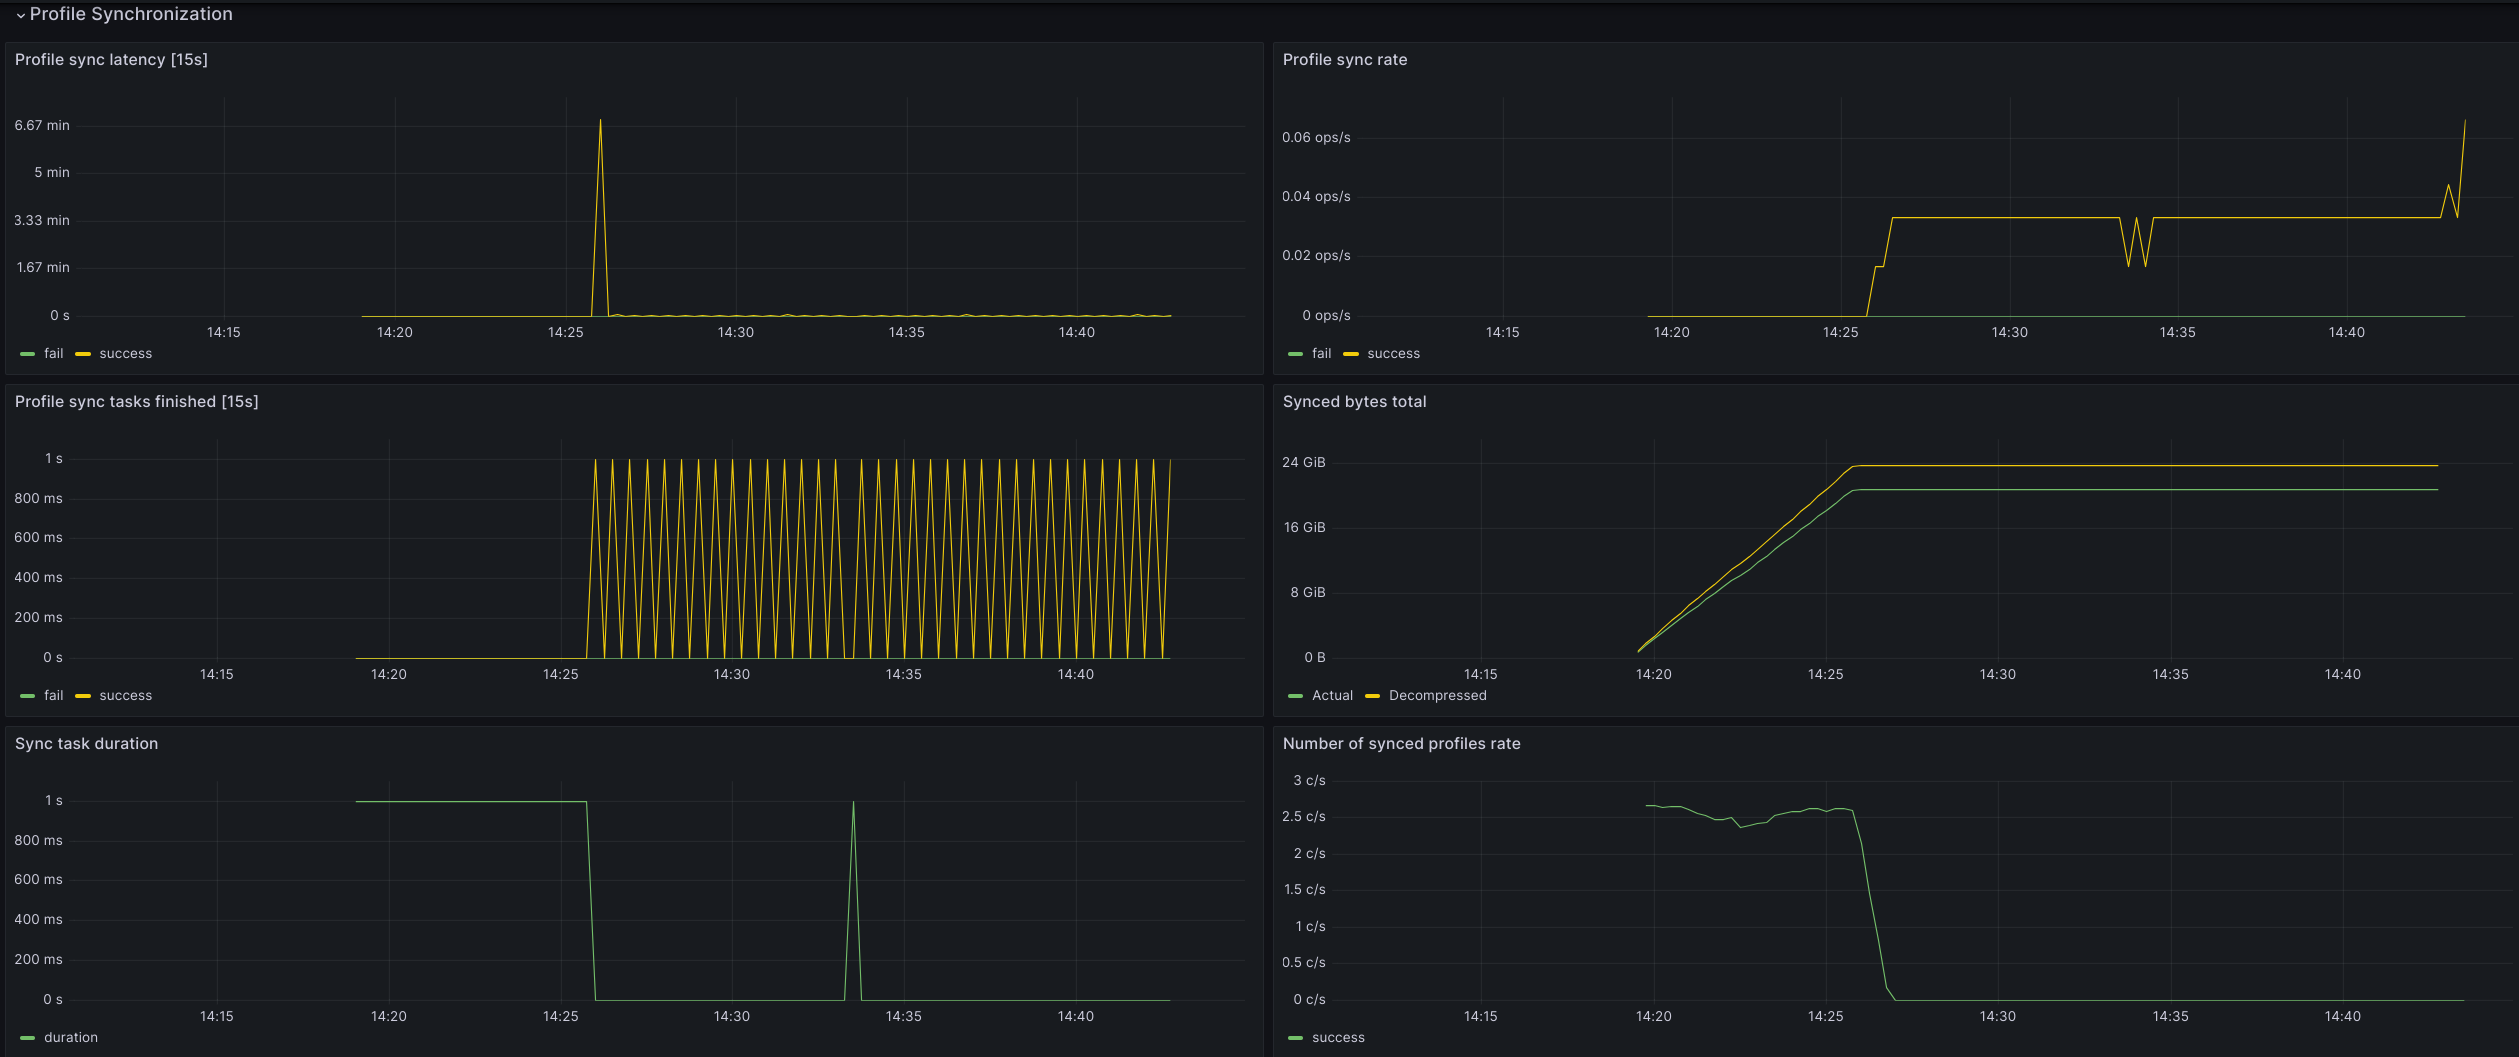
Profile Synchronization
Applicable when you have multiple Optimizer Hub clusters and profiles are synchronized between them. This section provides the following info:
-
Profile sync latency
-
Profile sync rate: speed of value changes of the metric
-
Profile sync tasks finished
-
Synced bytes total: sum of the synced bytes
-
Sync task duration: the duration of each task
-
Number of synced profiles rate