Troubleshooting Optimizer Hub
This page shows how to troubleshoot a misbehaving Optimizer Hub and any Azul Zing Build of OpenJDK (Zing) instances using Optimizer Hub.
Client VM Troubleshooting
My application gc.log contains PROFERR Failed to connect with the server and/or PROFERR Unable to load remote profile.
There is probably no -XX:OptHubHost specified, or an incorrect address of the server is provided. If no host is specified, the default value localhost:50051 is used instead of the correct address of the Optimizer Hub service. Please check Using ReadyNow Orchestrator for more information.
This can also be caused by trying to establish a TLS-encrypted connection with -XX:+OptHubUseSSL to a server which expects unencrypted connections, or vice versa.
Double-check your VM arguments. Ensure that VM is started with the -XX:OptHubHost= parameter pointing to the address of the Optimizer Hub gateway.
See Connecting a JVM to a Cloud Native Compiler for more details on Optimizer Hub-related VM parameters and Installing Optimizer Hub for finding out the gateway address.
My application running in a Cloud Native Compiler-enabled VM shows worse performance than usually. What can I do?
-
Double-check VM arguments. Ensure that VM is started with the
-XX:OptHubHost=parameter pointing to the address of the Optimizer Hub gateway.See Connecting a JVM to a Cloud Native Compiler for more details on Optimizer Hub-related VM parameters and Installing Optimizer Hub for finding out the gateway address.
-
Enable Optimizer Hub logging in VM using
-Xlog:concompparameter and look for log messages that show the JVM connecting to and disconnecting from Optimizer Hub.-
If the log says that the VM fails to connect to the service, check that the service is up and running, check the network connectivity between JVM and service, and check the value of
-XX:OptHubHost=. -
If the log says that VM disconnects from the service soon after connecting, the log should also give the reason for disconnecting. The most frequent reason for such disconnects is a missing Compiler Engine on the service, indicated by the
FAILED_PRECONDITIONerror code and messageCompiler engine … not found. See Registering a New Compiler Engine for more information. -
If the connection between the VM and service is established and does not break, then proceed to item #3.
-
-
Collect VM GC log, open it in GCLA and see top-tier compilation statistics. Top-tier compilation stats can also be seen in VM compilation log (
-XX:+PrintCompilation).-
If stats show high top-tier compilation failure ratio, then it’s time to troubleshoot Cloud Native Compiler.
-
Write down the VM ID seen in the VM concomp log, it can be used to filter service events related to this particular VM.
You can find the VM ID in
connected-compiler-%p.log:# Log command-line option -Xlog:concomp=info:file=connected-compiler-%p.log::filesize=500M:filecount=20 # Example: [0.647s][info ][concomp] [ConnectedCompiler] received new VM-Id: 4f762530-8389-4ae9-b64a-69b1adacccf2 -
Proceed to Cloud Native Compiler Server Troubleshooting.
-
-
Use the TTCOB metric to research possible problems.
An overloaded client (the JVM) can cause worse performance of Cloud Native Compiler. This could be seen as a too high TTCOB metric. One example of such overload is CPU saturation on JVM side. This can cause smaller amounts of compilations being sent to Cloud Native Compiler but also a worse performance of Cloud Native Compiler compilation because an overloaded JVM affects the communication between the CNC Compiler and JVM itself.
-
If TTCOB is over the threshold:
-
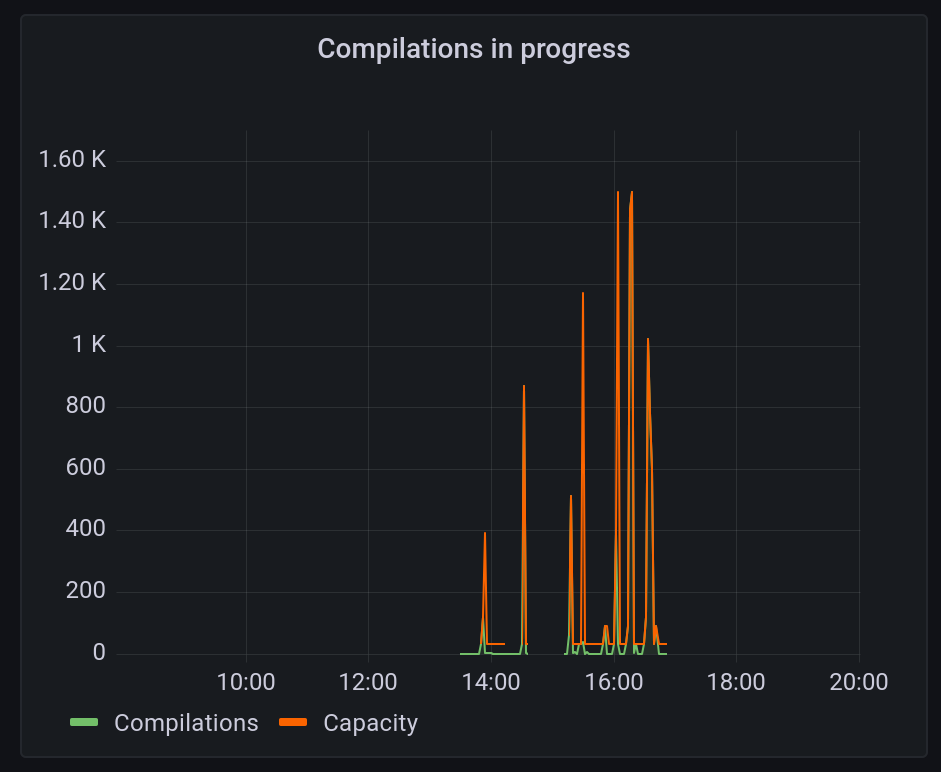
Look at the "Compilations in progress" chart.
-
If "Compilations" value hits the capacity, then the server is the bottleneck and should be scaled.

-
Otherwise the bottleneck is related to the per-VM limit on concurrent compilations. It should be increased. Scaling server without increasing that per-VM limit doesn’t help.
-
-
If TTCOB is below threshold:
-
How much below threshold is it?
-
If there is a gap between the actual TTCOB and the threshold, then Optimizer Hub can be downscaled proportionally to the gap.
-
Otherwise relax and don’t touch anything.
-
-
-
If scaling compile-brokers doesn’t improve TTCOB, the culprit may be the cache.
A typical symptom is cache CPU usage hitting the ceiling, depending on the workload. An example can be seen in this graph:

If that’s the case, one can modify simple sizing relationships to have more caches. This is the relevant section in the values.yaml:
 simpleSizing:
  relationships:
    brokersPerGateway: 30
    brokersPerCache: 20
Settings brokersPerCache to a lower value (e.g. 15) results in having more cache instances relative to compile-brokers.
I see occasional "compiler timeout" errors in service logs and/or grafana dashboard. What’s that?
Every compilation on Cloud Native Compiler has a time limit. By default it’s 500 seconds.
-
If that limit is exceeded, the first thing to check is network latency between VM and Cloud Native Compiler using
ping {opthub_host}. Latency should not exceed single-digit milliseconds. If the latency is higher, CNC can’t deliver its best performance. Make sure to locate VMs close enough to CNC. -
You can use the "VM rountrip" widget in the Grafana dashboard to detect if this limit is exceeded.
-
In rare cases there are very large compilations that actually require that long. If that’s the case, compilation timeout can be changed by adding
-Dcompiler.timeout={N}flag to compile-broker, where{N}is the number in seconds.
My application running in a Optimizer Hub-enabled VM behaves incorrectly or crashes. What can I do?
-
Collect all VM logs and the
hs_err*file and send it to Azul for analysis. -
Run the application without the
-XX:OptHubHostflag to verify that the problem is specific to connecting to Optimizer Hub.
I sometimes see entries about failed compilations because of "ConnectedCompiler is not yet ready", but I see it is compiling fine. Is that ok?
This may happen when running with SSL enabled. The VM keeps an open connection to the service, but sometimes the connection can be reset or re-established. It may happen that the VM tries to send a compilation request in the very moment. With SSL, the VM and the service need to do a handshake to make sure the connection is trusted. It is very quick, but it is possible the VM hits this small window. It is harmless as the compilation is resubmitted the next moment.
Cloud Native Compiler Troubleshooting
JVM compilation log shows that top-tier compilations are started, but never finished. What can I do?
This can be caused by one of these reasons:
-
No compile-broker pods are running in the Optimizer Hub cluster. Make sure that at least one compile-broker is up and running.
-
Cloud Native Compiler has too many compilation requests enqueued due to too many VMs connected and it takes too long to provide compiled code. To confirm, check the "Compilation Queues" chart in Grafana. Increase the number of compile-broker replicas.
I see occasional "vm unreachable" in service logs and/or grafana dashboard. What’s that?
This is caused by the service’s inability to receive some information necessary for the compilation from the JVM. It usually happens when the JVM disconnects from the service for any reason, e.g. JVM termination or a network error. It’s harmless. The service just skips the compilation and proceeds to the next one.
ReadyNow Orchestrator Troubleshooting
ReadyNow profile reading timed-out with pre-main exceeding 60 seconds.
In case of a service misconfiguration with the Optimizer Hub not being deployed, and compilation.limit.per.vm setting being set to a value higher than 0, Prime may attempt to use the service for compilations to no avail. It might take some time for Prime to automatically switch to the local Falcon compiler. This can severely impact the ability of ReadyNow to pre-compile methods before the application load is started thus limiting the overall effect of ReadyNow.
ReadyNow profiles can’t be download with many parallel requests
In case the gateway log shows multiple errors , like PoolAcquirePendingLimitException: Pending acquire queue has reached its maximum size of 1000" in gateway log, the number of gateways has to be increased. See Sizing and Scaling your Optimizer Hub Installation for more info.