Installing Optimizer Hub on minikube
minikube can be used for testing, evaluating, and non-cloud-managed blob storage use of Optimizer Hub.
Make sure your minikube meets the 18 vCore minimum for running Optimizer Hub. Although minikube can run on multiple platforms, Optimizer Hub is only available for the x64 platform, so not on macOS with M-processor.
Blob storage is required for Optimizer Hub and can be added to your minikube setup with MinIO.
Installing minikube
-
Install minikube for your platform following this installation guide.
-
Start minikube with some extra options to add the metrics server.
minikube start --addons=metrics-server --container-runtime=containerd
Installing Optimizer Hub
Optimizer Hub uses Helm as the deployment manifest package manager. There is no need to manually edit any Kubernetes deployment manifests.
-
Make sure your Helm version is
v3.8.0or newer, check it withhelm version. -
Add the Azul Helm repository to your Helm environment:
helm repo add opthub-helm https://azulsystems.github.io/opthub-helm-charts/ helm repo update -
Create a namespace (i.e.
my-opthub) for Optimizer Hub.minikube kubectl -- create namespace my-opthub -
Clone or download the files from the GitHub opthub-helm-charts repository.
git clone https://github.com/AzulSystems/opthub-helm-charts.git -
Create a directory for your configuration files
mkdir ~/my-opthub/ -
Create MinIO storage:
-
Copy minio-dev.yaml and replace
minio-devwithmy-opthubor the namespace you created in the previous step.cp ~/opthub-helm-charts/minio-dev.yaml ~/my-opthub/minio-dev.yaml sed -i 's/minio-dev/my-opthub/g' ~/my-opthub/minio-dev.yaml # `-i` modifies the original file # `s/old/new/g`: s = substitute, g = all occurrences -
Copy minio-setup-job.yaml and again replace
minio-dev.cp ~/opthub-helm-charts/minio-setup-job.yaml ~/my-opthub/minio-setup-job.yaml sed -i 's/minio-dev/my-opthub/g' ~/my-opthub/minio-setup-job.yaml -
Install the S3 compatible storage with:
minikube kubectl -- apply -f ~/my-opthub/minio-dev.yaml -f ~/my-opthub/minio-setup-job.yaml
-
-
Create a configuration file
values-minikube.yaml, based on the example file, to disable all resource definitions.cp ~/opthub-helm-charts/values-minikube.yaml ~/my-opthub/values-minikube.yamlModify the following value to match your environment:
# Existing storageEndpoint: http://minio.minio-dev.svc.cluster.local:9000 # Change to storageEndpoint: http://minio.my-opthub:9000 -
Create the configuration files for the monitoring tools (Prometheus and Grafana).
-
A file is needed for the role creation:
metrics-rbac.yaml-
Copy the file from the GitHub opthub-helm-charts repository.
-
Replace the namespace in two places
namespace: opthubin the example file, or execute:sed -i 's/opthub$/my-opthub/g' ~/my-opthub/metrics-rbac.yaml -
If you create your service accounts separately, you need to match these names with the ones in this file.
-
Apply these roles to your minikube:
minikube kubectl -- apply -f ~/my-opthub/metrics-rbac.yaml
-
-
Create a file with the monitoring configuration:
values-monitoring.yaml-
Copy the file from the GitHub opthub-helm-charts repository.
-
If you created your own service account, update this value in the file:
name: metrics-server.
-
-
Install the Kubernetes State Metrics service:
 helm install kube-state-metrics \
    oci://ghcr.io/prometheus-community/charts/kube-state-metrics
-
-
Install using Helm, passing in the
values-minikube.yamlandvalues-monitoring.yaml. In case you don’t want to install the full Optimizer Hub, but only a part of the services, first check "Configuring the Active Optimizer Hub Services".helm install opthub opthub-helm/azul-opthub \ -n my-opthub \ -f ~/my-opthub/values-minikube.yaml \ -f ~/my-opthub/values-monitoring.yamlThe command should produce output similar to this:
NAME: opthub LAST DEPLOYED: Mon Jan 30 14:35:29 2023 NAMESPACE: my-opthub STATUS: deployed REVISION: 1 TEST SUITE: None -
Verify that all started pods are ready:
$ minikube kubectl -- get all -n my-opthub NAME READY STATUS RESTARTS AGE pod/cache-0 1/1 Running 0 111s pod/compile-broker-9d8755469-hnc86 1/1 Running 0 111s pod/gateway-64dc66c9cd-8r87r 1/1 Running 0 111s pod/grafana-6dccb6d5bd-5wct5 2/2 Running 0 111s pod/gw-proxy-d9bc9f69d-mzqlb 1/1 Running 0 111s pod/mgmt-gateway-5fb49f767d-4rqnz 1/1 Running 0 111s pod/minio 1/1 Running 1 (2m17s ago) 3d20h pod/minio-setup-job-867vj 0/1 Completed 0 3d20h pod/prometheus-server-65d89b44d4-nshgg 1/1 Running 0 111s NAME TYPE CLUSTER-IP EXTERNAL-IP PORT(S) AGE service/cache ClusterIP None <none> 5701/TCP 111s service/compile-broker ClusterIP 10.101.186.209 <none> 50051/TCP 111s service/gateway LoadBalancer 10.108.230.242 <pending> 50051:31551/TCP 111s service/gateway-headless ClusterIP None <none> 50051/TCP 111s service/grafana NodePort 10.109.252.245 <none> 80:30529/TCP 111s service/grafana-headless ClusterIP None <none> 9094/TCP 111s service/mgmt-gateway LoadBalancer 10.108.223.142 <pending> 8080:30912/TCP 111s service/minio ClusterIP 10.107.144.95 <none> 9000/TCP,9090/TCP 3d20h service/prometheus-server ClusterIP 10.101.23.244 <none> 80/TCP 111s NAME READY UP-TO-DATE AVAILABLE AGE deployment.apps/compile-broker 1/1 1 1 111s deployment.apps/gateway 1/1 1 1 111s deployment.apps/grafana 1/1 1 1 111s deployment.apps/gw-proxy 1/1 1 1 111s deployment.apps/mgmt-gateway 1/1 1 1 111s deployment.apps/prometheus-server 1/1 1 1 111s NAME DESIRED CURRENT READY AGE replicaset.apps/compile-broker-9d8755469 1 1 1 111s replicaset.apps/gateway-64dc66c9cd 1 1 1 111s replicaset.apps/grafana-6dccb6d5bd 1 1 1 111s replicaset.apps/gw-proxy-d9bc9f69d 1 1 1 111s replicaset.apps/mgmt-gateway-5fb49f767d 1 1 1 111s replicaset.apps/prometheus-server-65d89b44d4 1 1 1 111s NAME READY AGE statefulset.apps/cache 1/1 111s NAME STATUS COMPLETIONS DURATION AGE job.batch/minio-setup-job Complete 1/1 12s 3d20h -
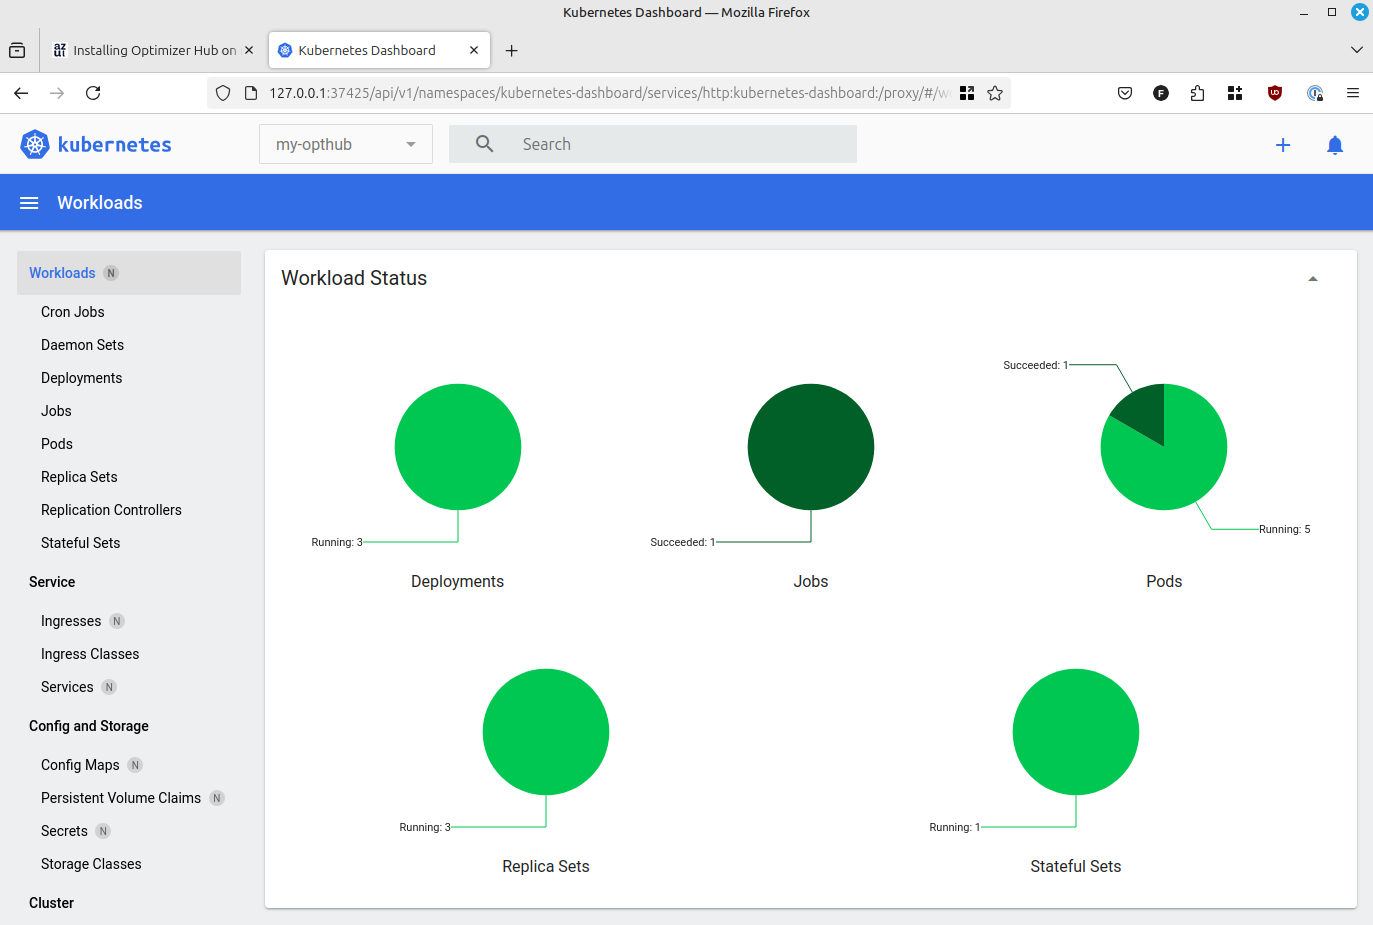
You can also verify the status on a dashboard in the browser with the following command. Select your namespace (
my-opthub) from the dropdown in the header of the page.minikube dashboard
-
Add port forwarding to have access to Grafana:
kubectl port-forward -n my-opthub deployments/gw-proxy 3000:3000 -
The Grafana dashboard is now available on
localhost:3000. At this moment, it only shows minimal data. Use this dashboard later, when you have connected your first clients.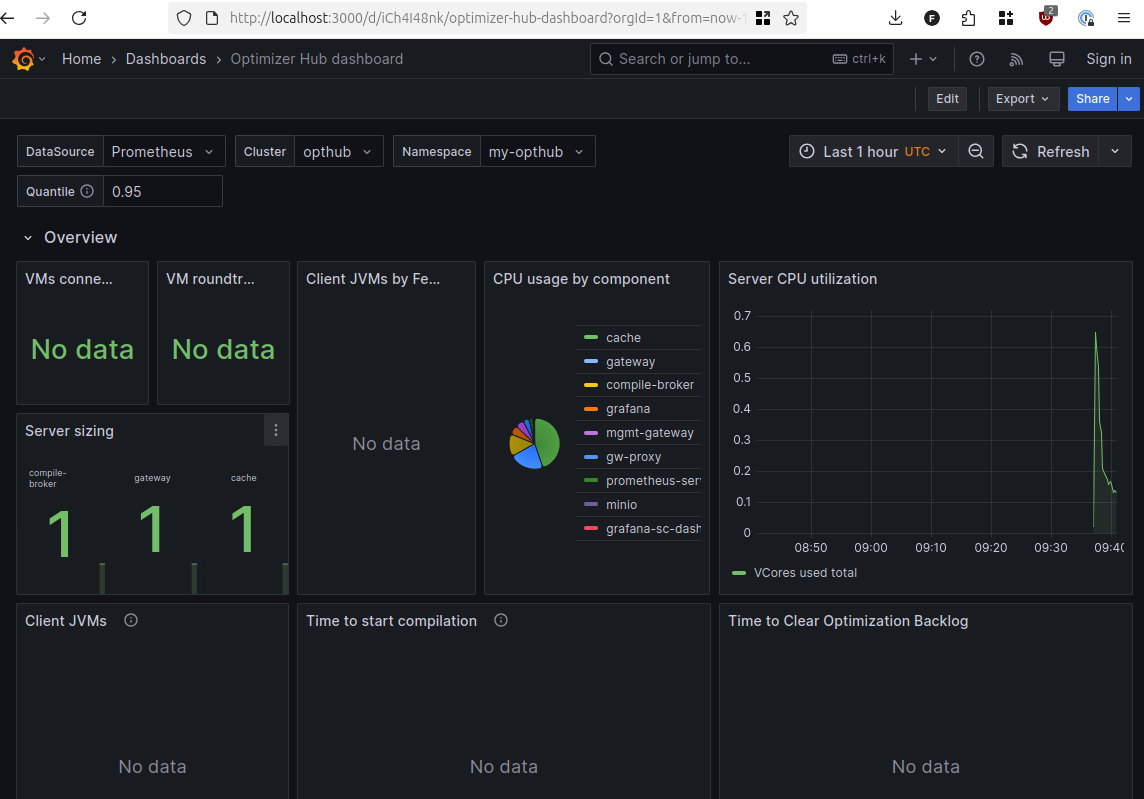
Uninstalling Optimizer Hub from minikube
Optimizer Hub can be removed from minikube using helm, after which the namespace can also be deleted.
 helm uninstall opthub -n my-opthub
minikube kubectl -- delete namespace my-opthub
minikube kubectl -- delete -f testing-rbac.yaml
helm repo remove opthub-helm