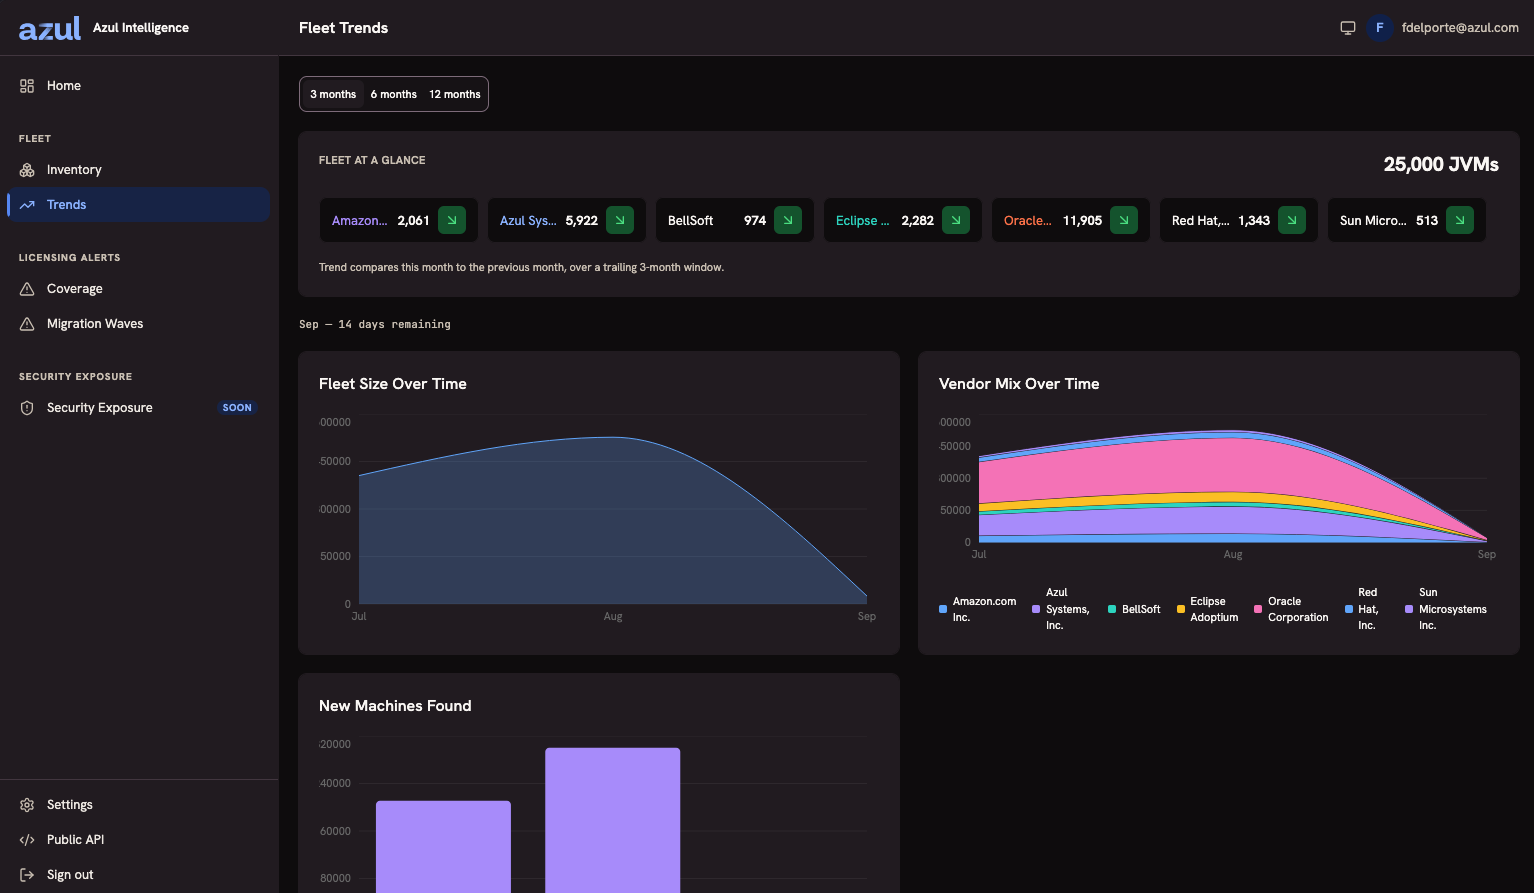
Trends
The inventory answers what your estate holds. Trends answers how it moves.
Choose the window at the top: 3, 6, or 12 months. Every chart on the page follows it.
Fleet size and vendor figures count machines, shown as Groups: a machine holding several JVM installations counts once, under the vendor of its most recent installation. New Machines Found counts installations.
Filtering the Trends
Trends take the same filter as Coverage: vendor, Java release, and license, each taking any number of values. Values of one field mean any of them, and different fields must all hold. With a filter set, every figure and chart describes only the machines with a matching installation, and the page says so beside the window line. The filter lives in the address, so a copied link reproduces the view.
Exclusion groups do not apply here: Trends count excluded installations like any other.
Fleet at a Glance
One tile per vendor, with the count of machines under that vendor and a trend indicator beside it, over the total fleet size for the window.
The indicator compares this month to the previous month, over a trailing 3-month window, and the line under the tiles says so. The comparison is always month over month, so widening the window changes the time axis of the charts and never what the indicator claims. The page also states how many days of the current month remain, so a partial month cannot be misread as a fall.
The Charts
| Chart | What it answers |
|---|---|
Fleet Size Over Time |
How many machines your estate held, month by month. |
Vendor Mix Over Time |
The same fleet stacked by vendor, which is where a migration shows up as one band growing while another shrinks. |
New Machines Found |
Installations per month by the month they were first observed. A discovery lands in the month of its earliest observation, so it never moves once it is counted. The calculation reads one month before the window to tell new installations from existing ones, so an installation that your estate reports less often than once a month can be counted as found more than once. |
Charts group by vendor, and each one covers a single tenant.
Why a Trend Cannot Disagree With the Inventory
Trends are aggregated from the observations every time you open the page, over the window you chose. There is no roll-up table behind them.
That has three consequences worth knowing:
-
There is no refresh to schedule and nothing to rebuild after an upgrade.
-
A trend cannot go stale, and cannot disagree with the inventory it summarises.
-
Every month inside the window you chose is on the axis. A month with no observations shows as zero rather than as a gap.
What Limits the Charts
The charts reach as far back as your installation has been collecting, within the window you selected. Observations are kept without a retention cutoff. See How Far Back the Inventory Reaches.
Ingestion also shapes them, and it is worth checking before you read a dip as a real fall: a month in which ingestion stopped is a month in which your installation was not looking. A spent ingestion allowance produces exactly that, and Quota and Usage is where you confirm it. The Licensing Alerts status report states it on its face for the period it covers.