Using Java Flight Recorder
The Java Flight Recorder (JFR) feature allows you to record JVM, system, and Java level events to monitor the behavior and troubleshoot problems in your Java applications. Keeping the overhead of the recording process low, Azul Zing Builds of OpenJDK (Zing) Java Flight Recorder records a large amount of information about your system from command-line parameters and system properties to time spent executing a piece of code.
JFR is available in Zing without the need for command-line options to enable it.
To collect a JFR recording for your application, you can either use the jcmd tool, interactively connect to a Java process from the Azul Mission Control desktop application, or add -XX:StartFlightRecording to the application’s java command line to collect the recording from JVM startup.
Azul Mission Control is recommended for browsing JFR recordings generated by Azul Prime. This tool is available for download here:
https://www.azul.com/products/components/azul-mission-control/.
Collect a JFR Recording with jcmd
On the same host and userid as the java process under analysis, run the following command to start a recording:
jcmd JVMID JFR.start filename=rec.jfr
Where JVMID is either the process ID or the classname assigned with the java process as shown when running jcmd without parameters.
To stop a recording, use:
jcmd JVMID JFR.stop name=1
To start a recording with more detailed metrics, use the following instead:
jcmd JVMID JFR.start filename=rec.jfr settings=profile
See the JFR options table below for a comprehensive list of options.
Collect a JFR Recording using Azul Mission Control
You can directly collect the JFR in Azul mission Control without using the command line or terminal. Collecting a JFR recording in Azul Mission Control requires establishing a connection between Azul Mission Control and the running JVM.
Azul Mission Control allows either local or remote connections to the JVM. Remote connections require enabling the JVM’s JMX connector first. More details can be found in the Azul Mission Control documentation, Connecting to a Remote JVM.
After the connection is established, you can start collecting the JFR using the steps outlined in the Azul Mission Control documentation, Starting a JFR Recording in Azul Mission Control.
Collect a JFR Recording from JVM Startup
For detailed performance analysis, you might prefer to start a JFR recording directly when launching a java process.
To start recording from JVM startup, add -XX:StartFlightRecording to the application’s java command line.
Use a comma "," for separation when using multiple options. For example:
java -XX:StartFlightRecording=duration=30s,filename=myrecording.jfr TestRecorder
See the JFR options table below for a comprehensive list of options.
Using Async-Profiler to Collect a JFR Recording
Async-Profiler is an open-source profiler for Java and current versions are able to record in JFR format. Using Async-Profiler can reduce overhead, especially while recording memory profiling and cpu profiling.
Example usage of Async-Profiler to capture CPU utilization and Java heap allocation in JFR format on a running JVM for 120 seconds:
asprof --all-user -e cpu,alloc -d 120 -o jfr -f asyncrec.jfr JVMID
Analyzing a JFR Recording
It is recommended to use Azul Mission Control to view JFR recordings.
Alternatively, a Java Flight recording can be viewed using the jfr command-line option.
Using Azul Mission Control for JFR Analysis
In Azul Mission Control, You can either drag and drop a JFR recording from any host into Azul Mission Control, or directly collect the JFR using Azul Mission Control.
Azul Mission Control has more uses than just recording and viewing JFR recordings, such as actively monitoring JVM resource usage through MBeans. More info about Azul Mission Control can be found in the Azul Mission Control Documentation.
Using Zing Live Objects
Zing Live Objects help determine the type of objects that are leaking while troubleshooting memory leaks. To identify and address a memory leak using information gathered in a Zing flight recording, complete the following steps.
To create a Zing flight recording for inspection, use the following arguments:
java -XX:StartFlightRecording=duration=<recording_time_duration>,settings=profile,filename=<recording_filename>.jfr
The Flight Recorder has two configuration files: default and profile.
To enable the Live Objects feature, you need to enable ZingOldObjectSample in the configuration file. By default, ZingOldObjectSample is enabled only in the profile configuration file in versions of Zing prior to 19.12.0.0. Starting with ZVM 19.12.0.0, ZingOldObjectEvent is disabled by default in all configurations.
|
Note
|
|
By default, the amount of live set events recorded by Java Flight Recorder is set to 99%. To decrease the recording file size, you can set the value of the JFRDescribeLiveSetPercentage command-line option to a number less than 99:
java -XX:JFRDescribeLiveSetPercentage=90 -XX:StartFlightRecording=duration=<recording_time_duration>,settings=profile,filename=<recording_filename>.jfr
When a recording is started, the output should look similar to the snippet below:
 $ /home/username/<JDK_installation_path>/bin/java -XX:StartFlightRecording=settings=profile,filename=myrecording.jfr
Started recording 1.
Use jcmd 32747 JFR.dump name=1 to copy recording data to file.
If just a filename without a path is specified (i.e., filename=<recording_filename>.jfr), the flight recording is saved to the directory from which you ran the command.
To specify the path of your choice, use:
filename=<path>/<recording_filename>.jfr
Once you create a Zing Flight recording, start the Azul Mission Control tool and open your Zing Flight recording from the File menu.
If you do not have Azul Mission Control on your machine, download the installer file from Download Azul Mission Control and see Downloading and Starting Azul Mission Control for installation instructions if needed.
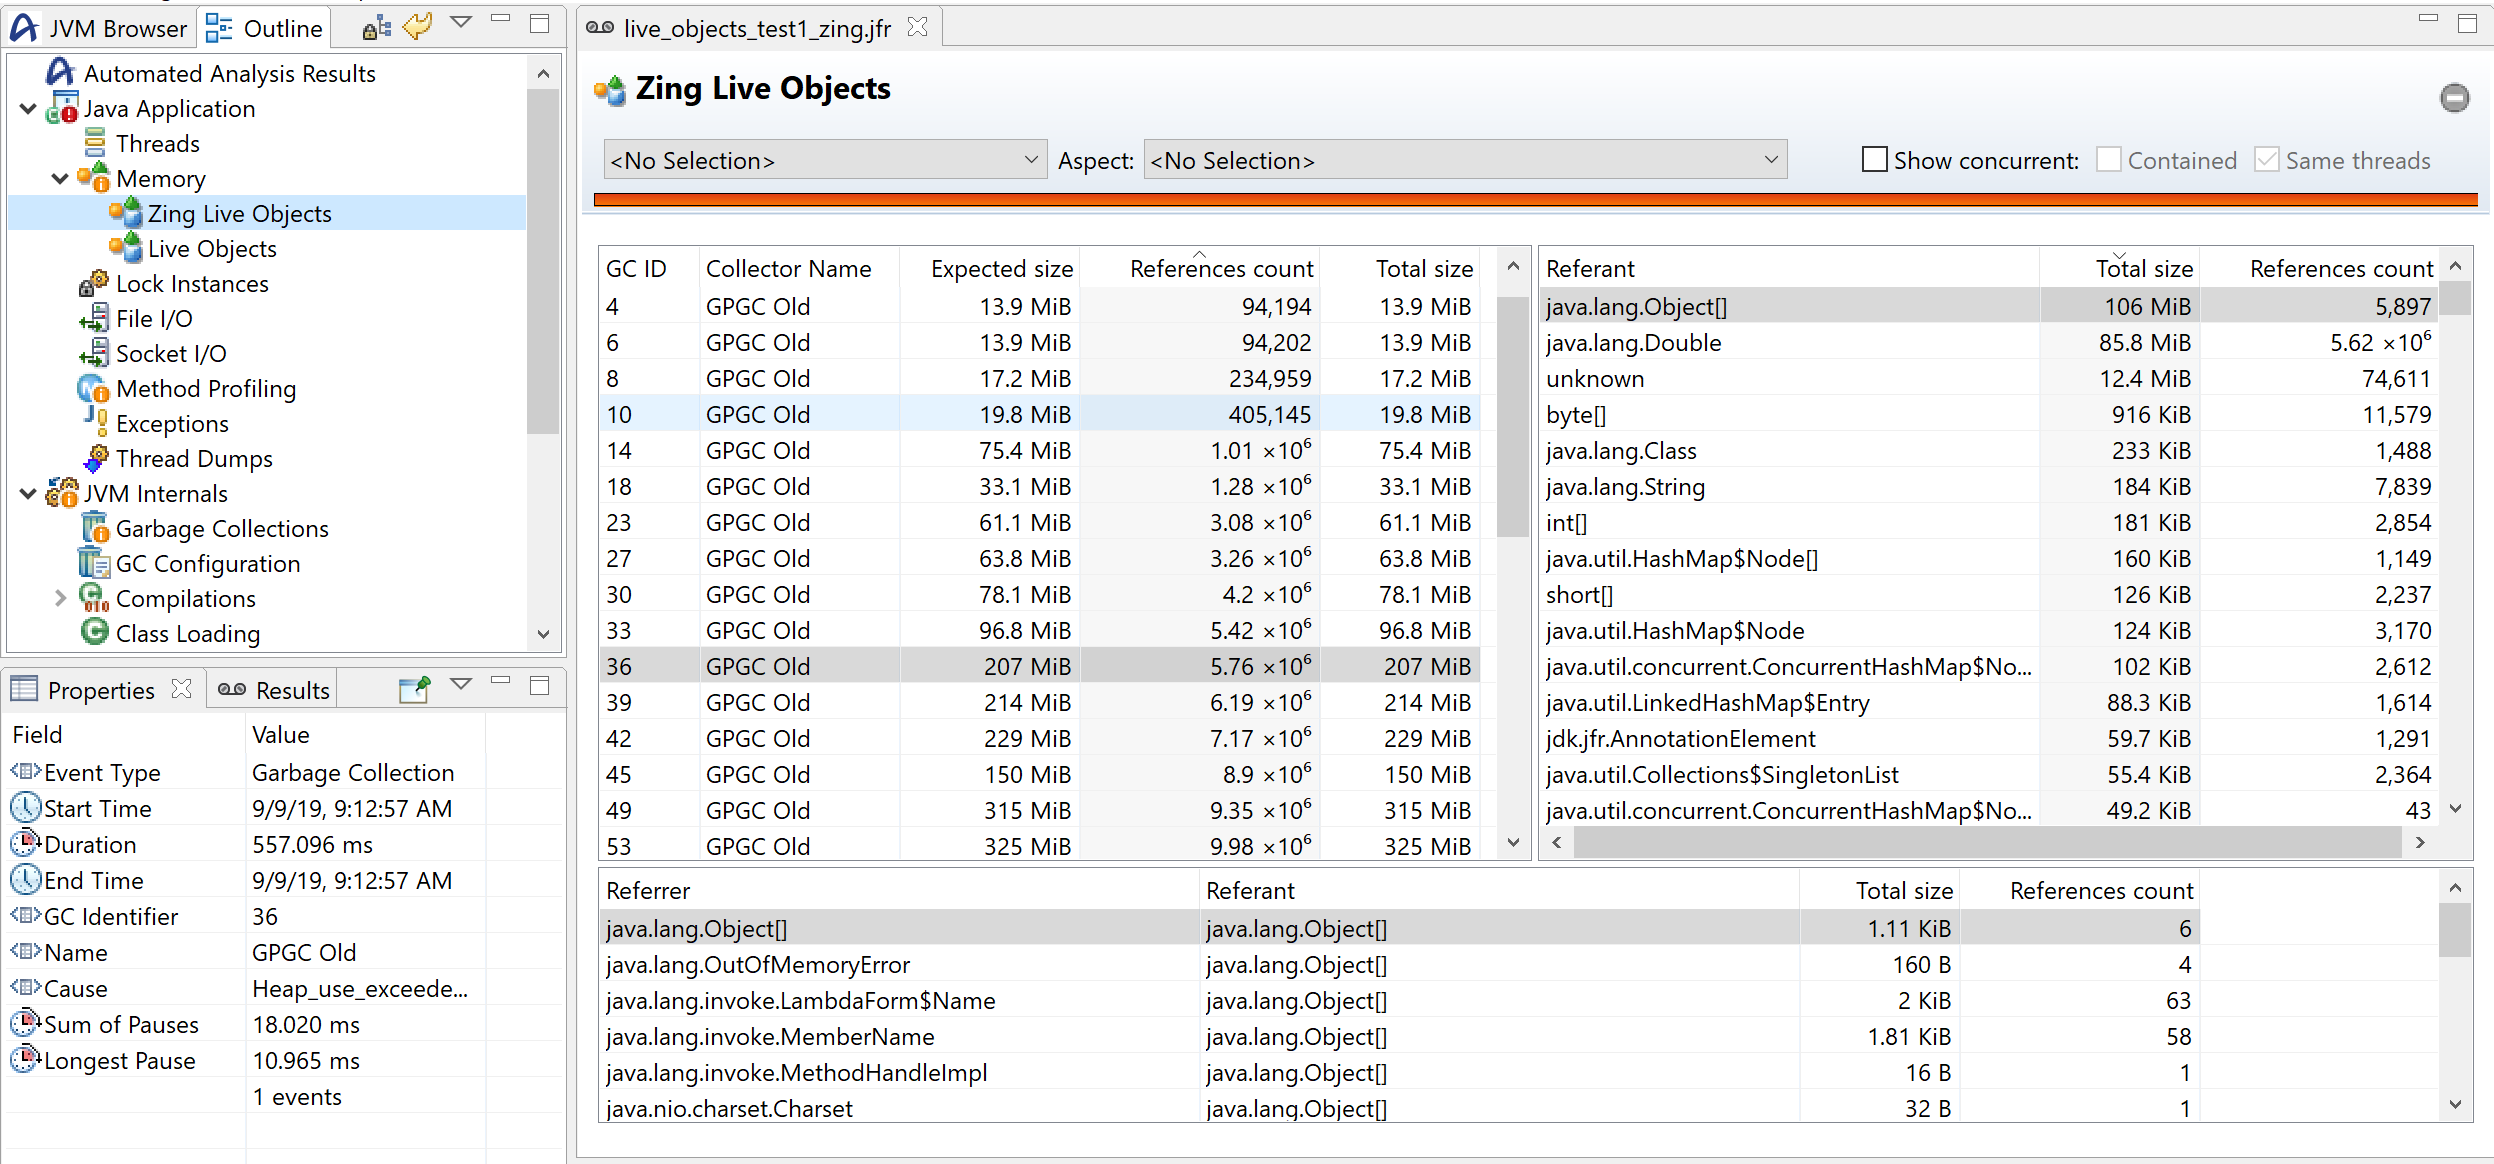
In the Outline navigation tree, select Memory > Zing Live Objects to display the set of live objects captured in the recording.
Study and compare GC cycles in the table with garbage collection identifiers (GC ID) for a live set suddenly increasing in size which indicates a memory leak.
Live objects types marked during each selected GC cycle display in the table to the right when a specific GC cycle is chosen.
Sort out live objects in a GC cycle by the total size to track the live object type with the biggest size and select a potentially leaking object type in the Referent column.
All items that refer to a potentially leaking object type display in the Referrer column in the bottom table. The latter helps identify the source of the leaking object by reference count.
(Optional) To retrieve more information, repeat step 5 if needed.
When a potentially leaking class is identified on the Zing Live Objects sub-tab, use the Memory tab to get information about the allocation site. The Memory tab contains allocation sites, which lead to allocation in a new thread local allocation buffer (TLAB) or allocation outside a TLAB, sorted by type. Checking stack traces for a potentially leaking class can help to stop the real place in code where the leak occurs.
In case the Memory tab does not help to find the leak, but the leak is still suspected, the Method Profiling tab might be used for this purpose. It is less convenient compared to the Memory tab, as it shows method calls of concrete types, not allocation sites.
Usually, the Zing Live Objects sub-tab and the Memory tab are all you need to find a leak.
Inspect the Stack Trace of your candidates to track where most memory allocation pressure comes from.
Using TTSP JFR Events
Azul Prime 20.07.0.0 introduces support for profiling Time To Safepoint (TTSP) issues based on data about Zing events collected in a Java Flight Recording (JFR).
To profile an existing TTSP issue using information gathered in a flight recording, complete the following steps:
-
Create a flight recording for inspection using the following arguments:
java -XX:StartFlightRecording=name=<recording_name>,filename=<recording_filename>.jfr,settings=profileThe Flight Recorder has
defaultandprofileconfiguration files. By default, theTimeToSafepointIssueevent, which activates TTSP issue profiling, is enabled in all configurations. Use the following options to configure the event settings file for the Java Flight Recorder:Configuring Option Description Default -XX:[+/-]SafepointWaitTimeProfiler
Generates asynchronous signals to log safepoint issues.
true-XX:SafepointProfilerRealTimeSignalNumber=<number>
Specifies the number of real time signals used for safepoint profiling.
4-XX:SafepointProfilerThresholdMS=<number>
Specifies the number of milliseconds to start safepoint profiling.
0-XX:SafepointProfilerThreshold=<number>
Specifies the threshold percentage value to start safepoint profiling.
2-XX:SafepointProfilerInterval=<number>
Specifies the interval percentage value for safepoint profiling.
10-XX:SafepointProfilerMaxBuffers=<number>
Specifies the number of safepoint profiler buffers to track.
100-XX:SafepointWaitTimeProfilerLog=<log file>
Specifies the log file to write safepoint profiling data to.
stderrNoteThe profile settings may increase performance overhead due to collecting more data by the Java Flight Recorder. Customizing any settings file, either default or profile, may incur increased performance overhead. -
Once you create a Zing Flight recording, start the Azul Mission Control tool and open your Zing Flight recording from the File menu.
If you do not have Azul Mission Control on your machine, download the installer file from Download Azul Mission Control and see the Installation Guidelines if needed.
-
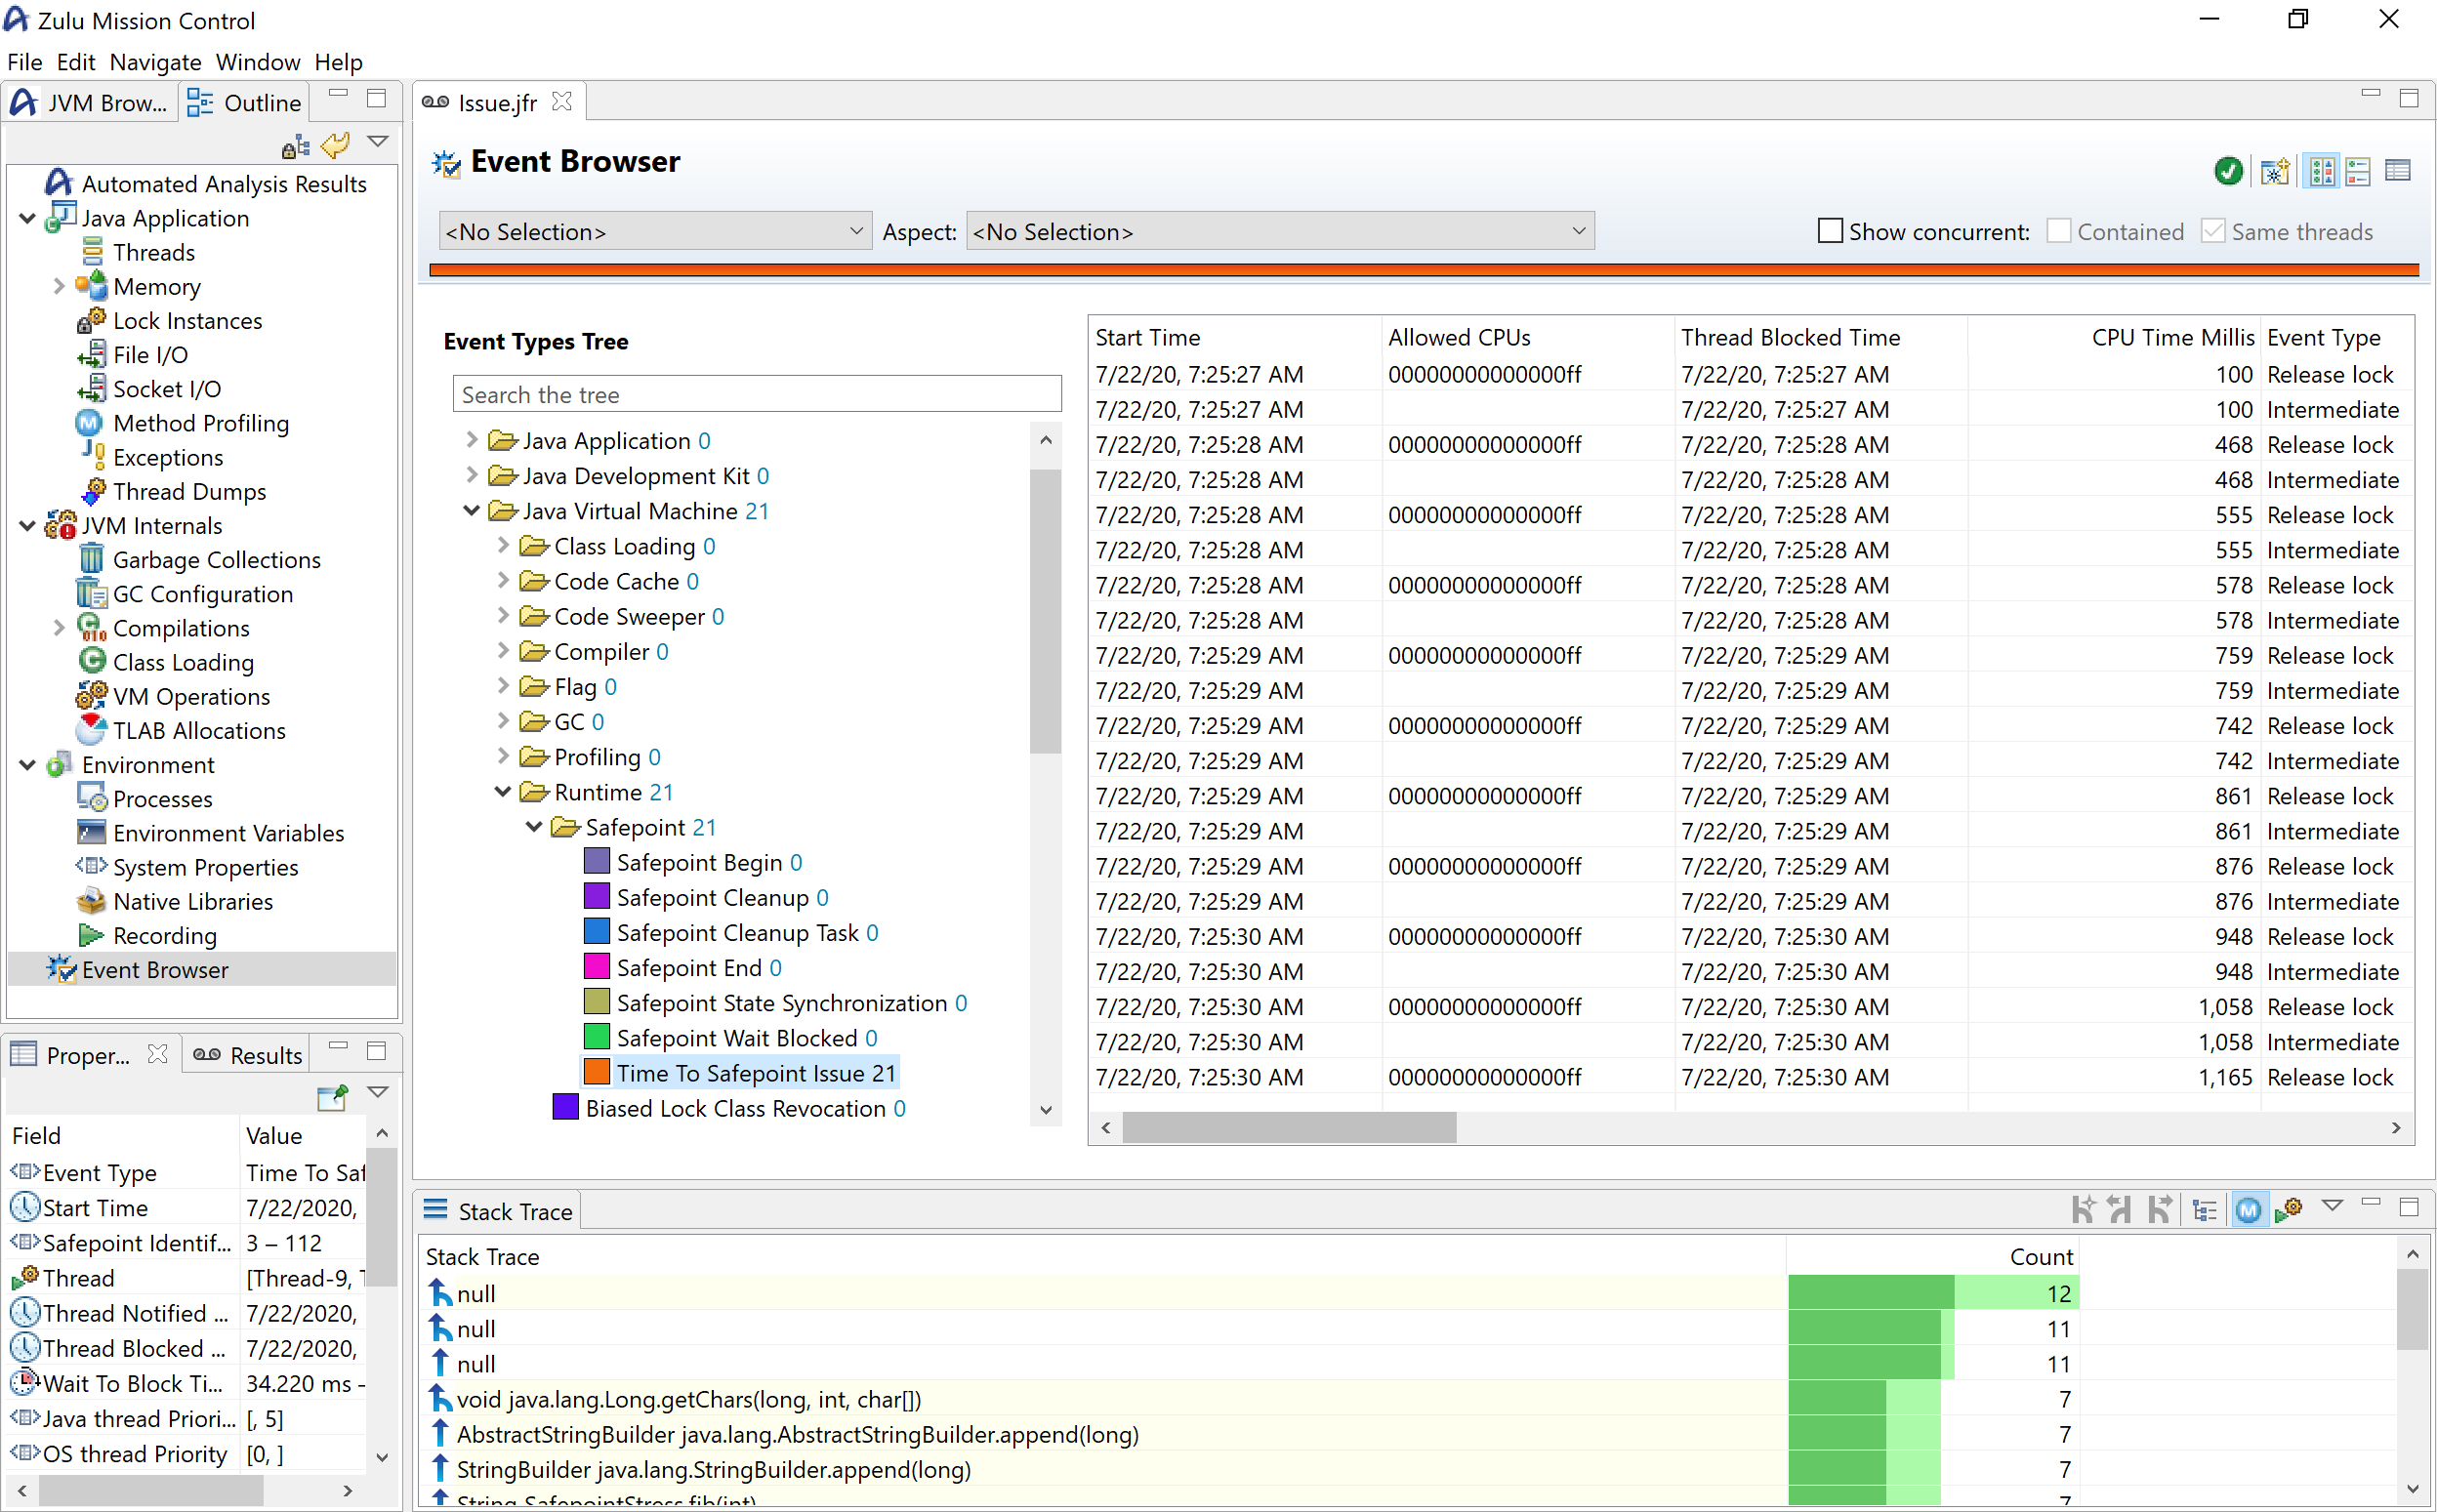
In the Outline navigation tree, choose Event Browser.
-
In the Event Types Tree, select Java Virtual Machine > Runtime > Safepoint to display the set of Safepoint event types captured in the recording.
-
In case of a TTSP issue, check the Event Browser table.
The contents of the Stack Trace window may help you understand the cause of the issue.
JFR Options
| Option | Description | Default |
|---|---|---|
settings=<path/to/settings/file> |
Specifies the configuration file to be used. In case of a custom configuration file, use the full path to the .jfc file. Otherwise, use one of the following presets:
|
default |
disk=<true, false> |
Controls whether to create a temporary recording file under the path set in the |
true |
repository=<path/to/temp/recording> |
Specifies the path for a temporary recording if the |
/tmp/ |
filename=<filename.jfr> |
Specifies the file name of the generated recording. You can add a path to the recording filename to change the file location. The recording file stays empty and only gets populated once the recording finishes. |
hotspot-pid.jfr |
duration=<time in specified unit> |
Specifies the recording length. Used time units: ns/ms/s/m/h/d. For example, 1800s or 30m. |
0, unlimited |
delay=<time in specified unit> |
Specifies the amount of time that the recorder must wait before starting to record. Used time units: ns/ms/s/m/h/d. For example, 1800s or 30m. |
0 |
dumponexit=<true, false> |
Controls whether to generate a recording file (dump a recording) if the JVM shuts down and the |
false |
name=<identifier> |
Specifies a name identifier for the recording. This is useful when working from jcmd and operating multiple recordings running at the same time. |
1,2,3,4,… |