Using the GC Log Analyzer
|
Note
|
This page refers to features of GC Log Analyzer specific to Azul Zing Builds of OpenJDK (Zing). For general GC Log Analyzer documentation, visit the GC Log Analyzer documentation website |
Working with Graphs
The Garbage Collector Log Analyzer (GC Log Analyzer) offers more than 70 different graphs of log file data that provide insight into the behavior and performance of your application, Zing, and the runtime environment.
Most of the time, you need to quickly know whether the overall system is performing well. To accomplish this task, you can consult the required group of graphs that helps you visualize the GC activity and detect performance anomalies.
Opening a GC Log File
To open a GC Log file, specify the path to your GC Log file as an argument when starting the GC Log Analyzer (e.g., java -jar ./GCLogAnalyzer2.jar ./gc.log).
Alternatively, run the GC Log Analyzer and use any of the following options to open your GC Log file:
-
Select File > Open File from the main menu. In the dialog box that opens, browse for your log file and click Open.
-
Drag your GC Log file and drop it in the GC Log Analyzer window.
-
Choose Open Recent Files from the File menu to view files you’ve recently opened.
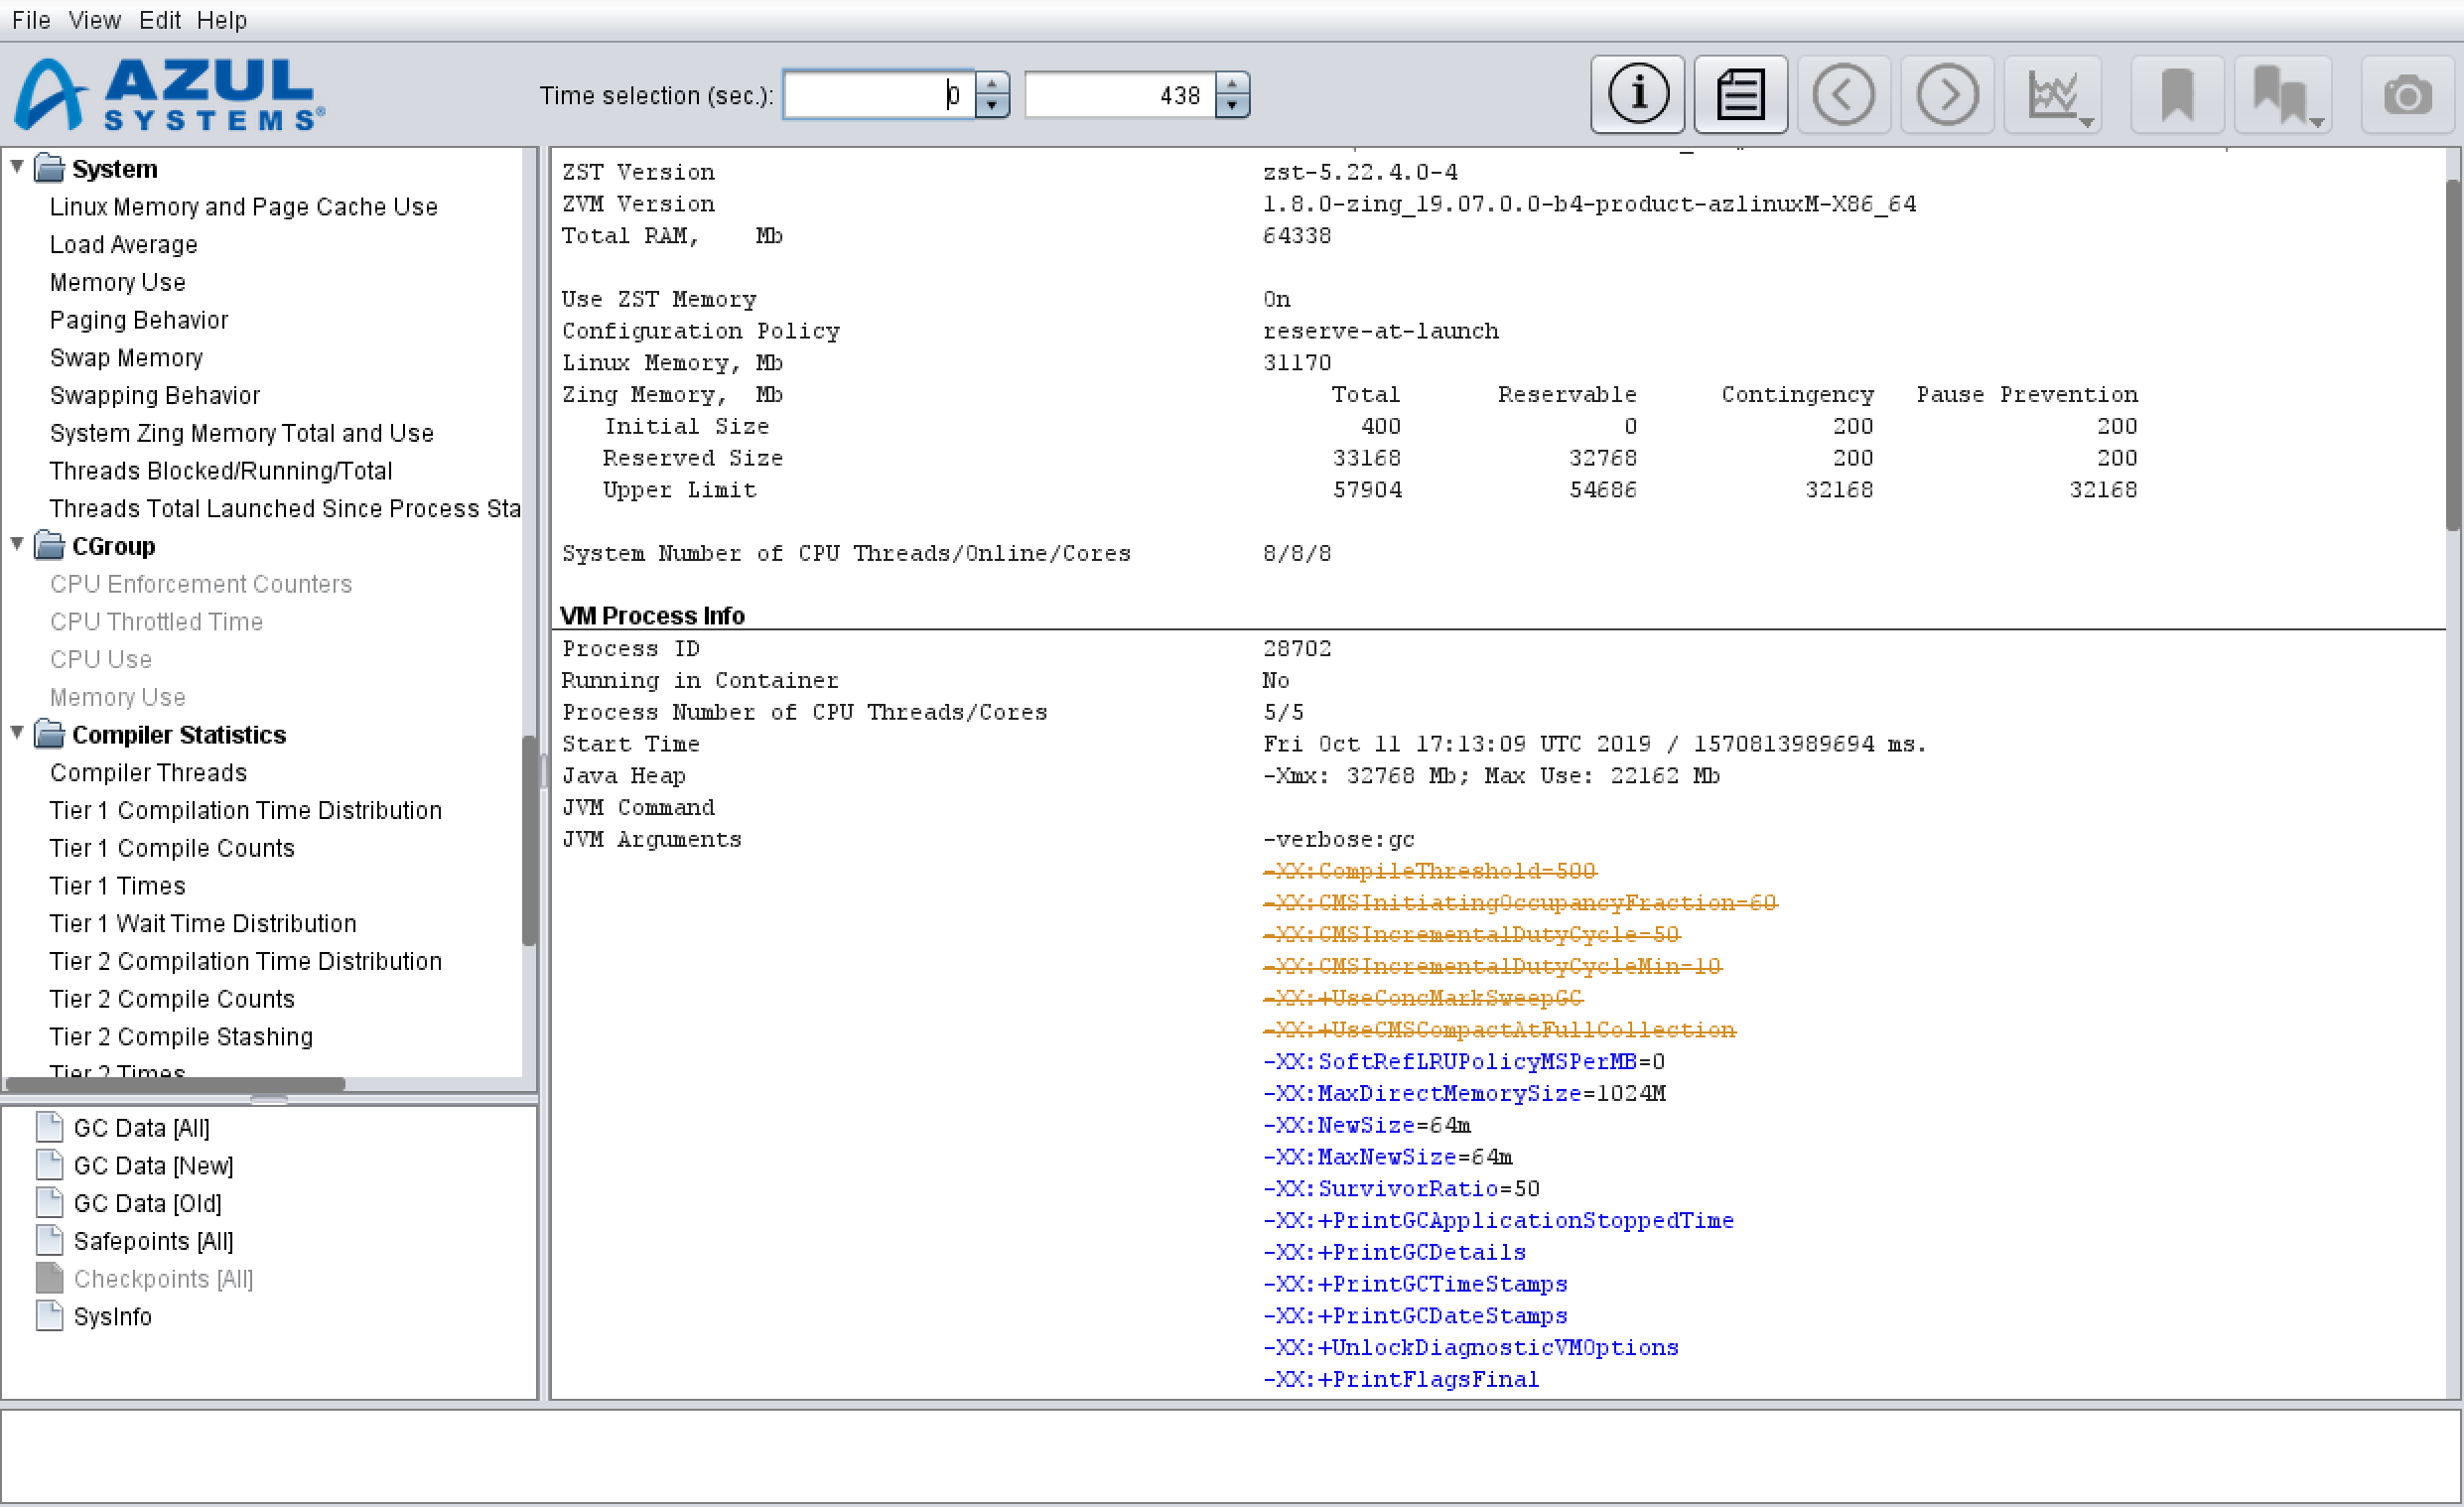
Your GC Log summary displays.

In the VM Process Info part of the log summary, hover your mouse over a JVM argument to view either the description of the option (highlighted with blue) or the note that the argument is ignored (highlighted with orange and crossed).
Using the Graphs Window
The Graphs window has groups that you can expand to view subgroups of graphs.
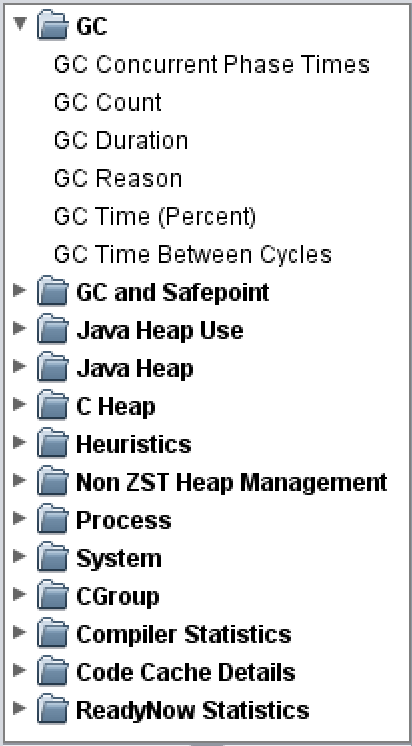
To quickly search for a graph, start typing the graph name in the Graphs window. This expands all the groups, displays the search field and the graph.
Use the Up and Down keyboard arrow keys to navigate through the graphs.
Using the Table View
You can use the table view located below the Graphs window for displaying GC Log data in the tabular format for analysis.
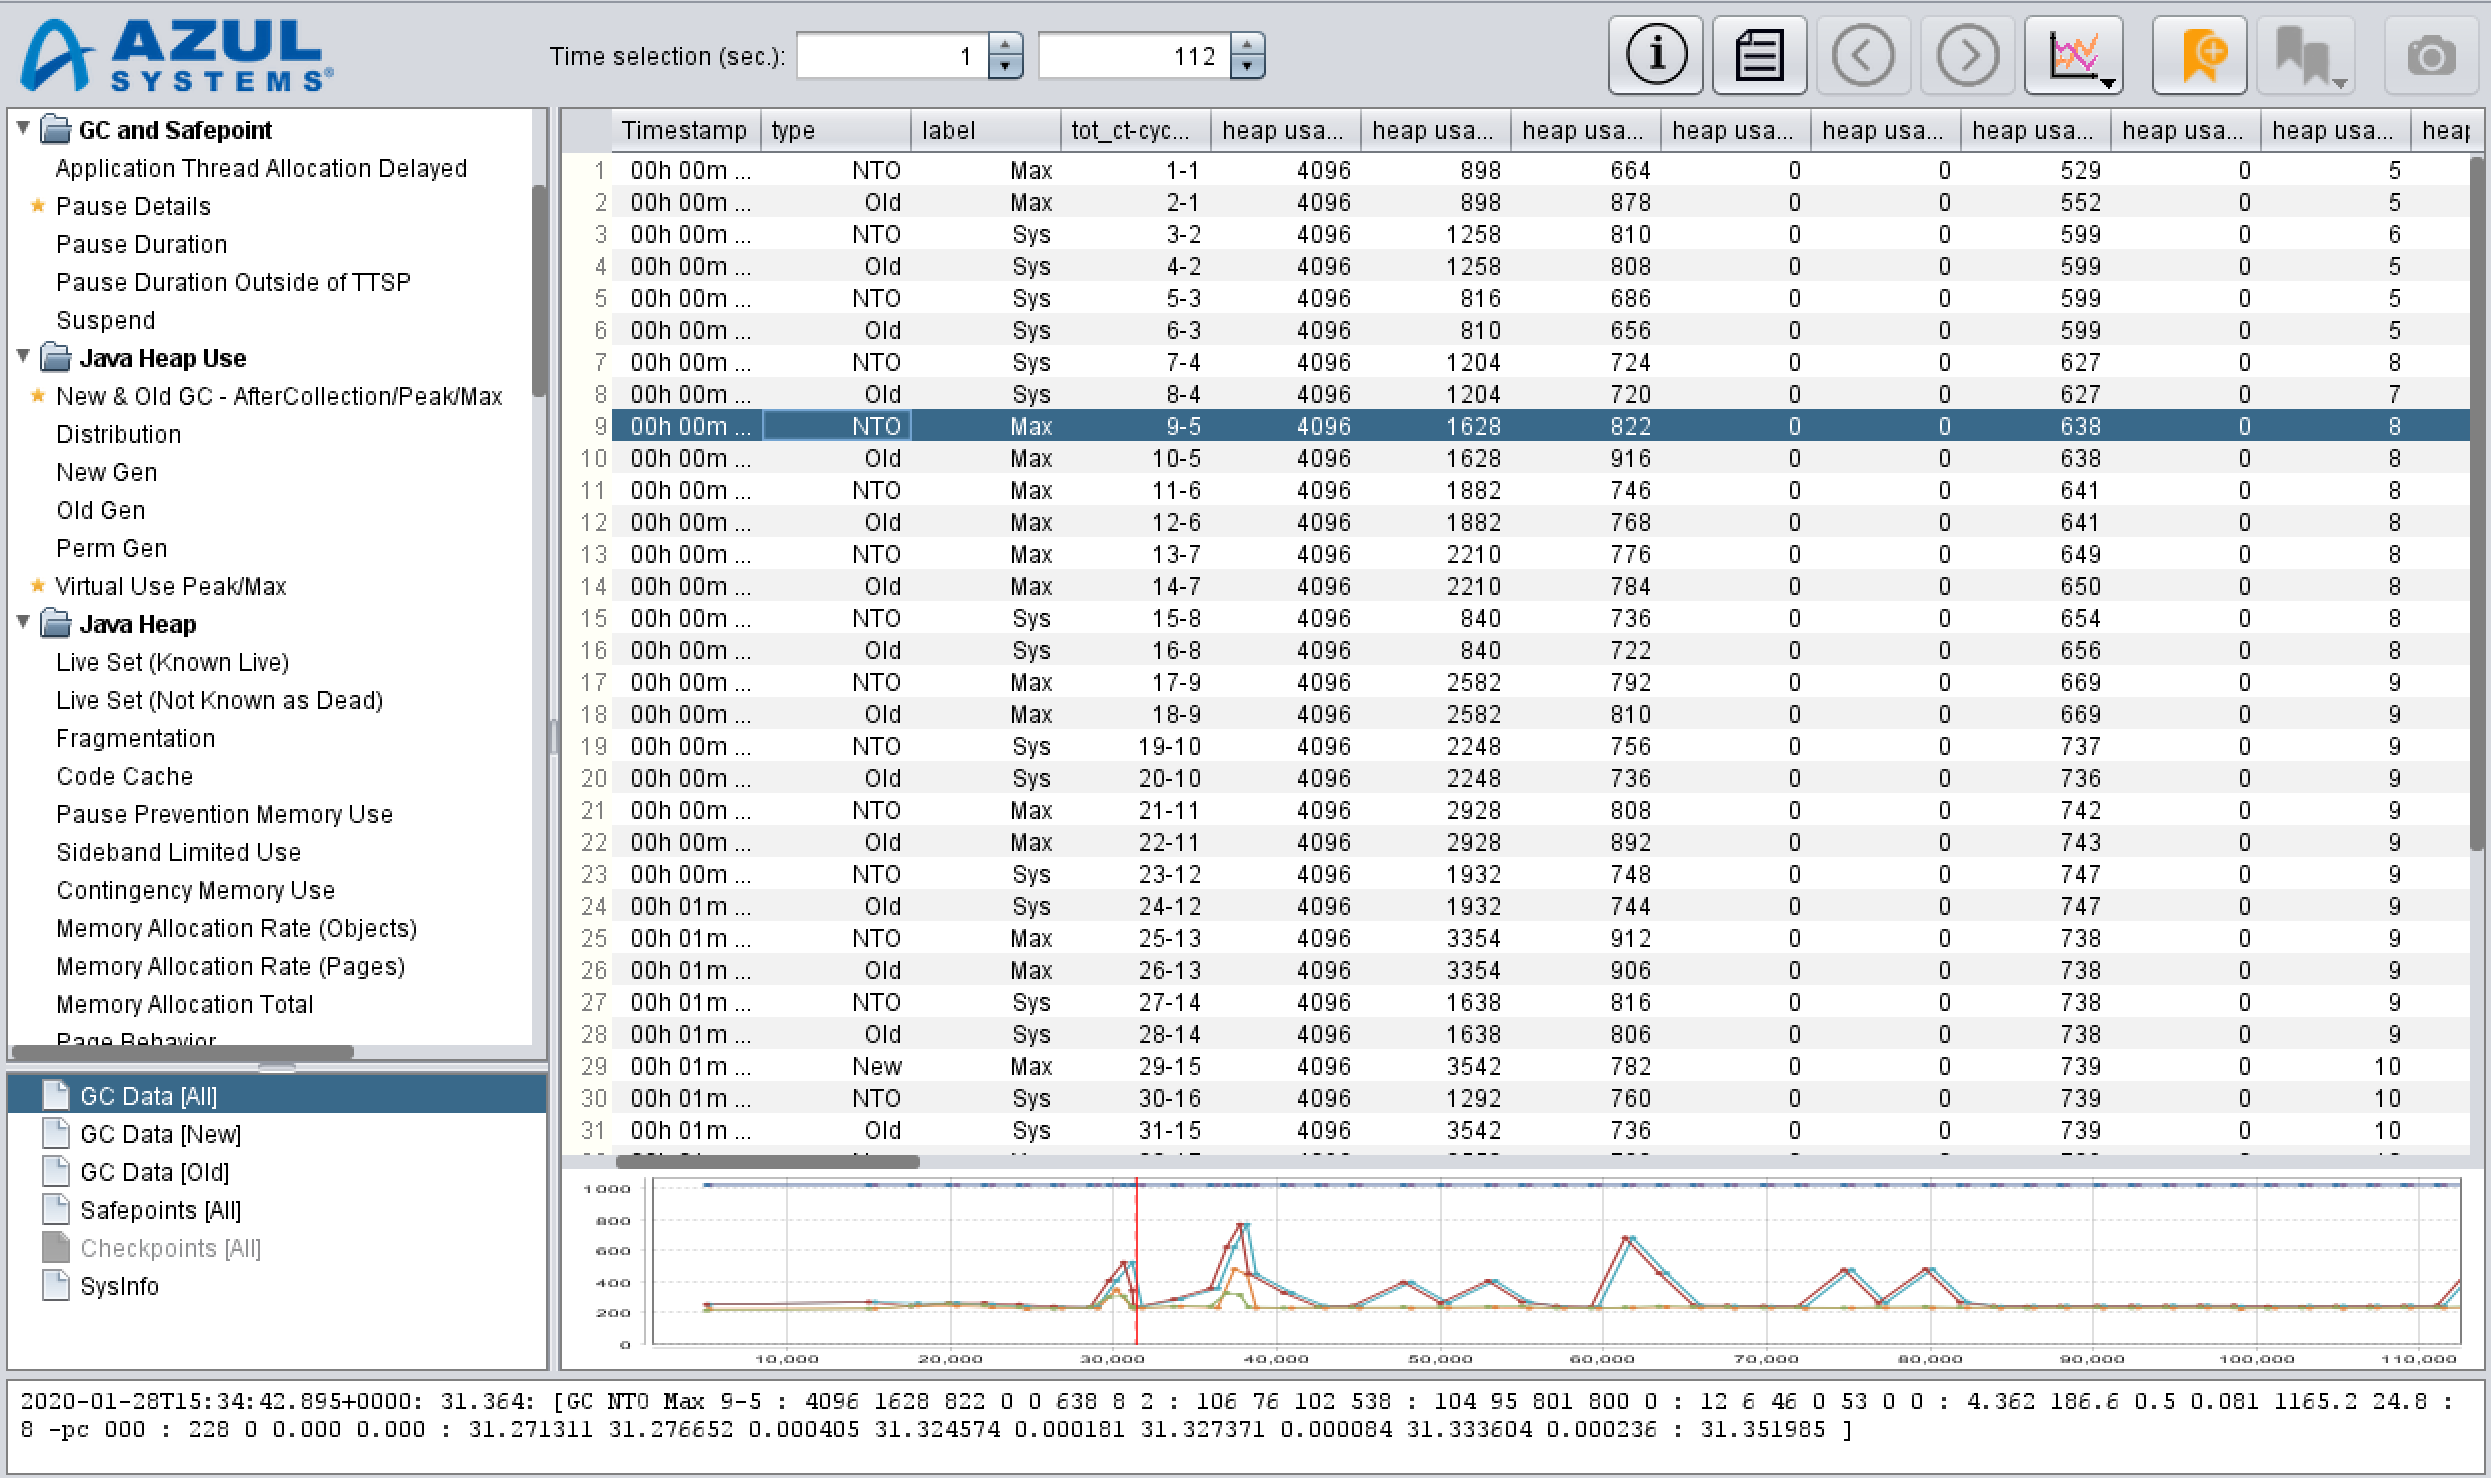
Selecting a line in the table displays the following:
-
A red vertical line connecting related points on the graph below the table
-
The data for the selected line under the minimized graph
To display detailed information about each value at the bottom of the window, hover your mouse over the value.
Using the Toolbar
The toolbar at the top of the GC Log Analyzer window contains a set of buttons you can use to perform common tasks for every selected graph.

-
Time selection (sec.): Allows to specify a time-based range in seconds to display in the graph window.
-
View GC Log Summary: Provides a cumulative and structured summary of the data collected in your GC log.
-
View GC Log: Displays a GC log in the text format, a graph in the pane below, as well as the selected line of a log at the bottom of the GC Log Analyzer window.
-
Select Previous Item: Displays the previous element in the same series in your GC log. This option becomes available after you have chosen a highlighted line in the log or a dot on a graph.
-
Select Next Item: Displays the following element in the same series in your GC log. This option becomes available after you have chosen a highlighted line in the log or a dot on a graph.
-
Select Data Series: Allows to choose what data series to display on the current graph.
-
Add Mark/Delete Mark: Allows to add or delete labeled marks applied to a log line or graph element. This option becomes available after you have chosen a log line or a graph element.
-
Select Visible Marklines: Displays or hides all labeled marks you made in the log line or graph element.
-
Export Current Graph to PNG: Saves a snapshot of the currently selected graph as a PNG image.
Switching Between the Graph and Log Views
You can switch between the Graph and Log views to work with your data.
From Graph to Log
To switch from the Graph to Log view, do either of the following:
-
select a point on the graph and click the View GC Log button in the toolbar
-
double-click on a point on the graph
This displays the Log view with a highlighted GC log line that corresponds to the point selected in the Graph view.
From Log to Graph
To switch from the Log to Graph view, select a graph in the graphs tree on the left.
Selecting Items on a Graph or in a Log
When you click on a dot of a graph to select a corresponding event, an associated GC log line displays in the bottom window, and the numerical field that the selected dot is plotted from is highlighted.

While viewing a GC log, you can click a GC log line to select it. This displays a thin red vertical bar on a preview chart to help identify the location of the selected line in the run.
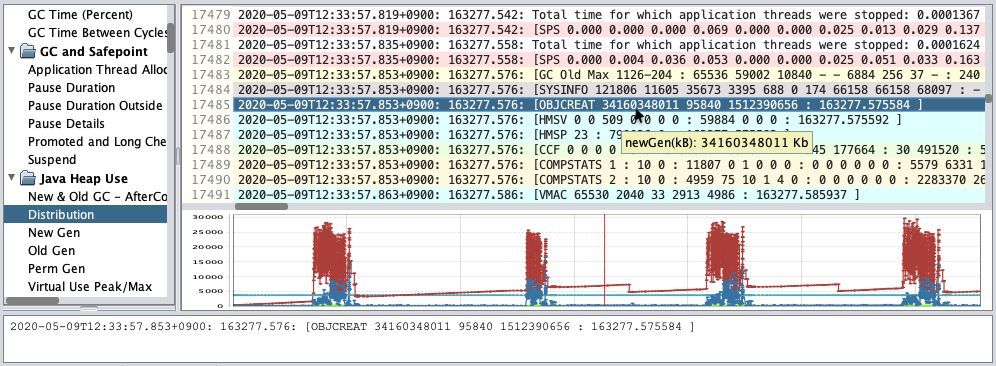
If the selected line is colored (i.e., it is one of the lines that chart data is extracted from), it is replicated in the bottom window that fits the entire line for easier analysis.
Hovering a mouse over a numerical field in either presentations of the line reveals a descriptive tooltip.
Zooming In and Out
Rubber-Band Selection
Position the pointer inside a chart, click and drag it in the direction from the top-left to the bottom-right edge of the chart. This enlarges the area selected with your pointer.
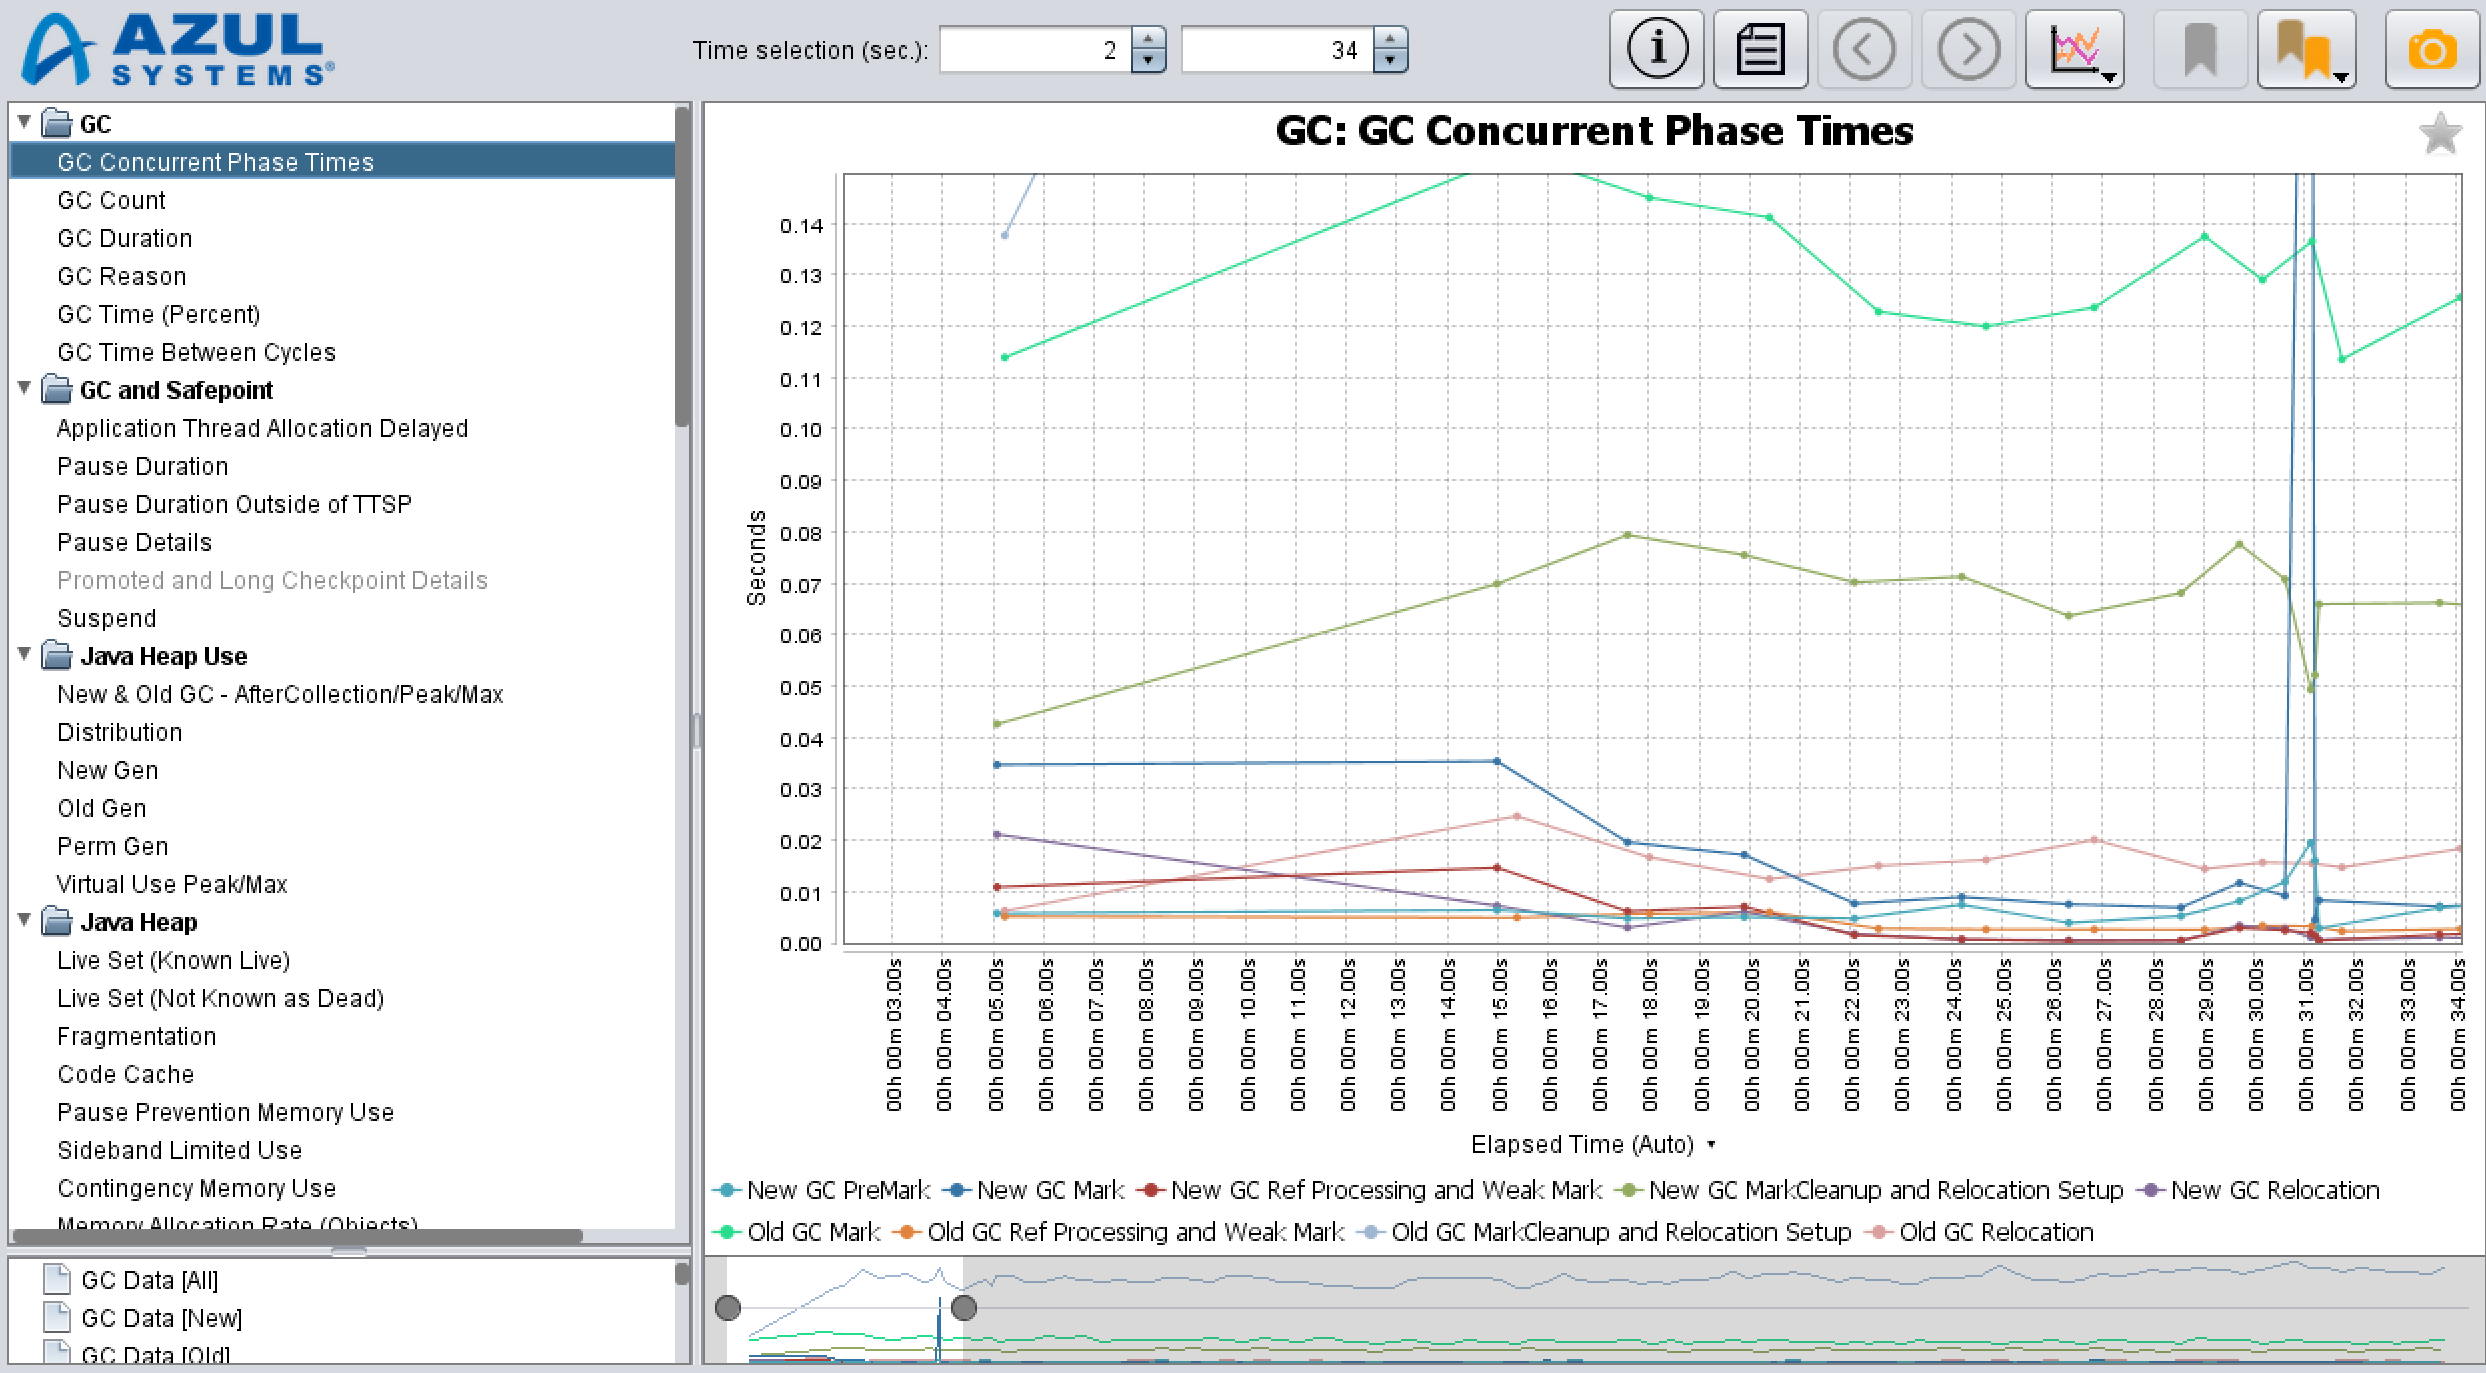
Double-click inside the enlarged area of the chart to automatically adjust the Y-axis so that all dots of all currently visible lines within the currently visible time frame display.
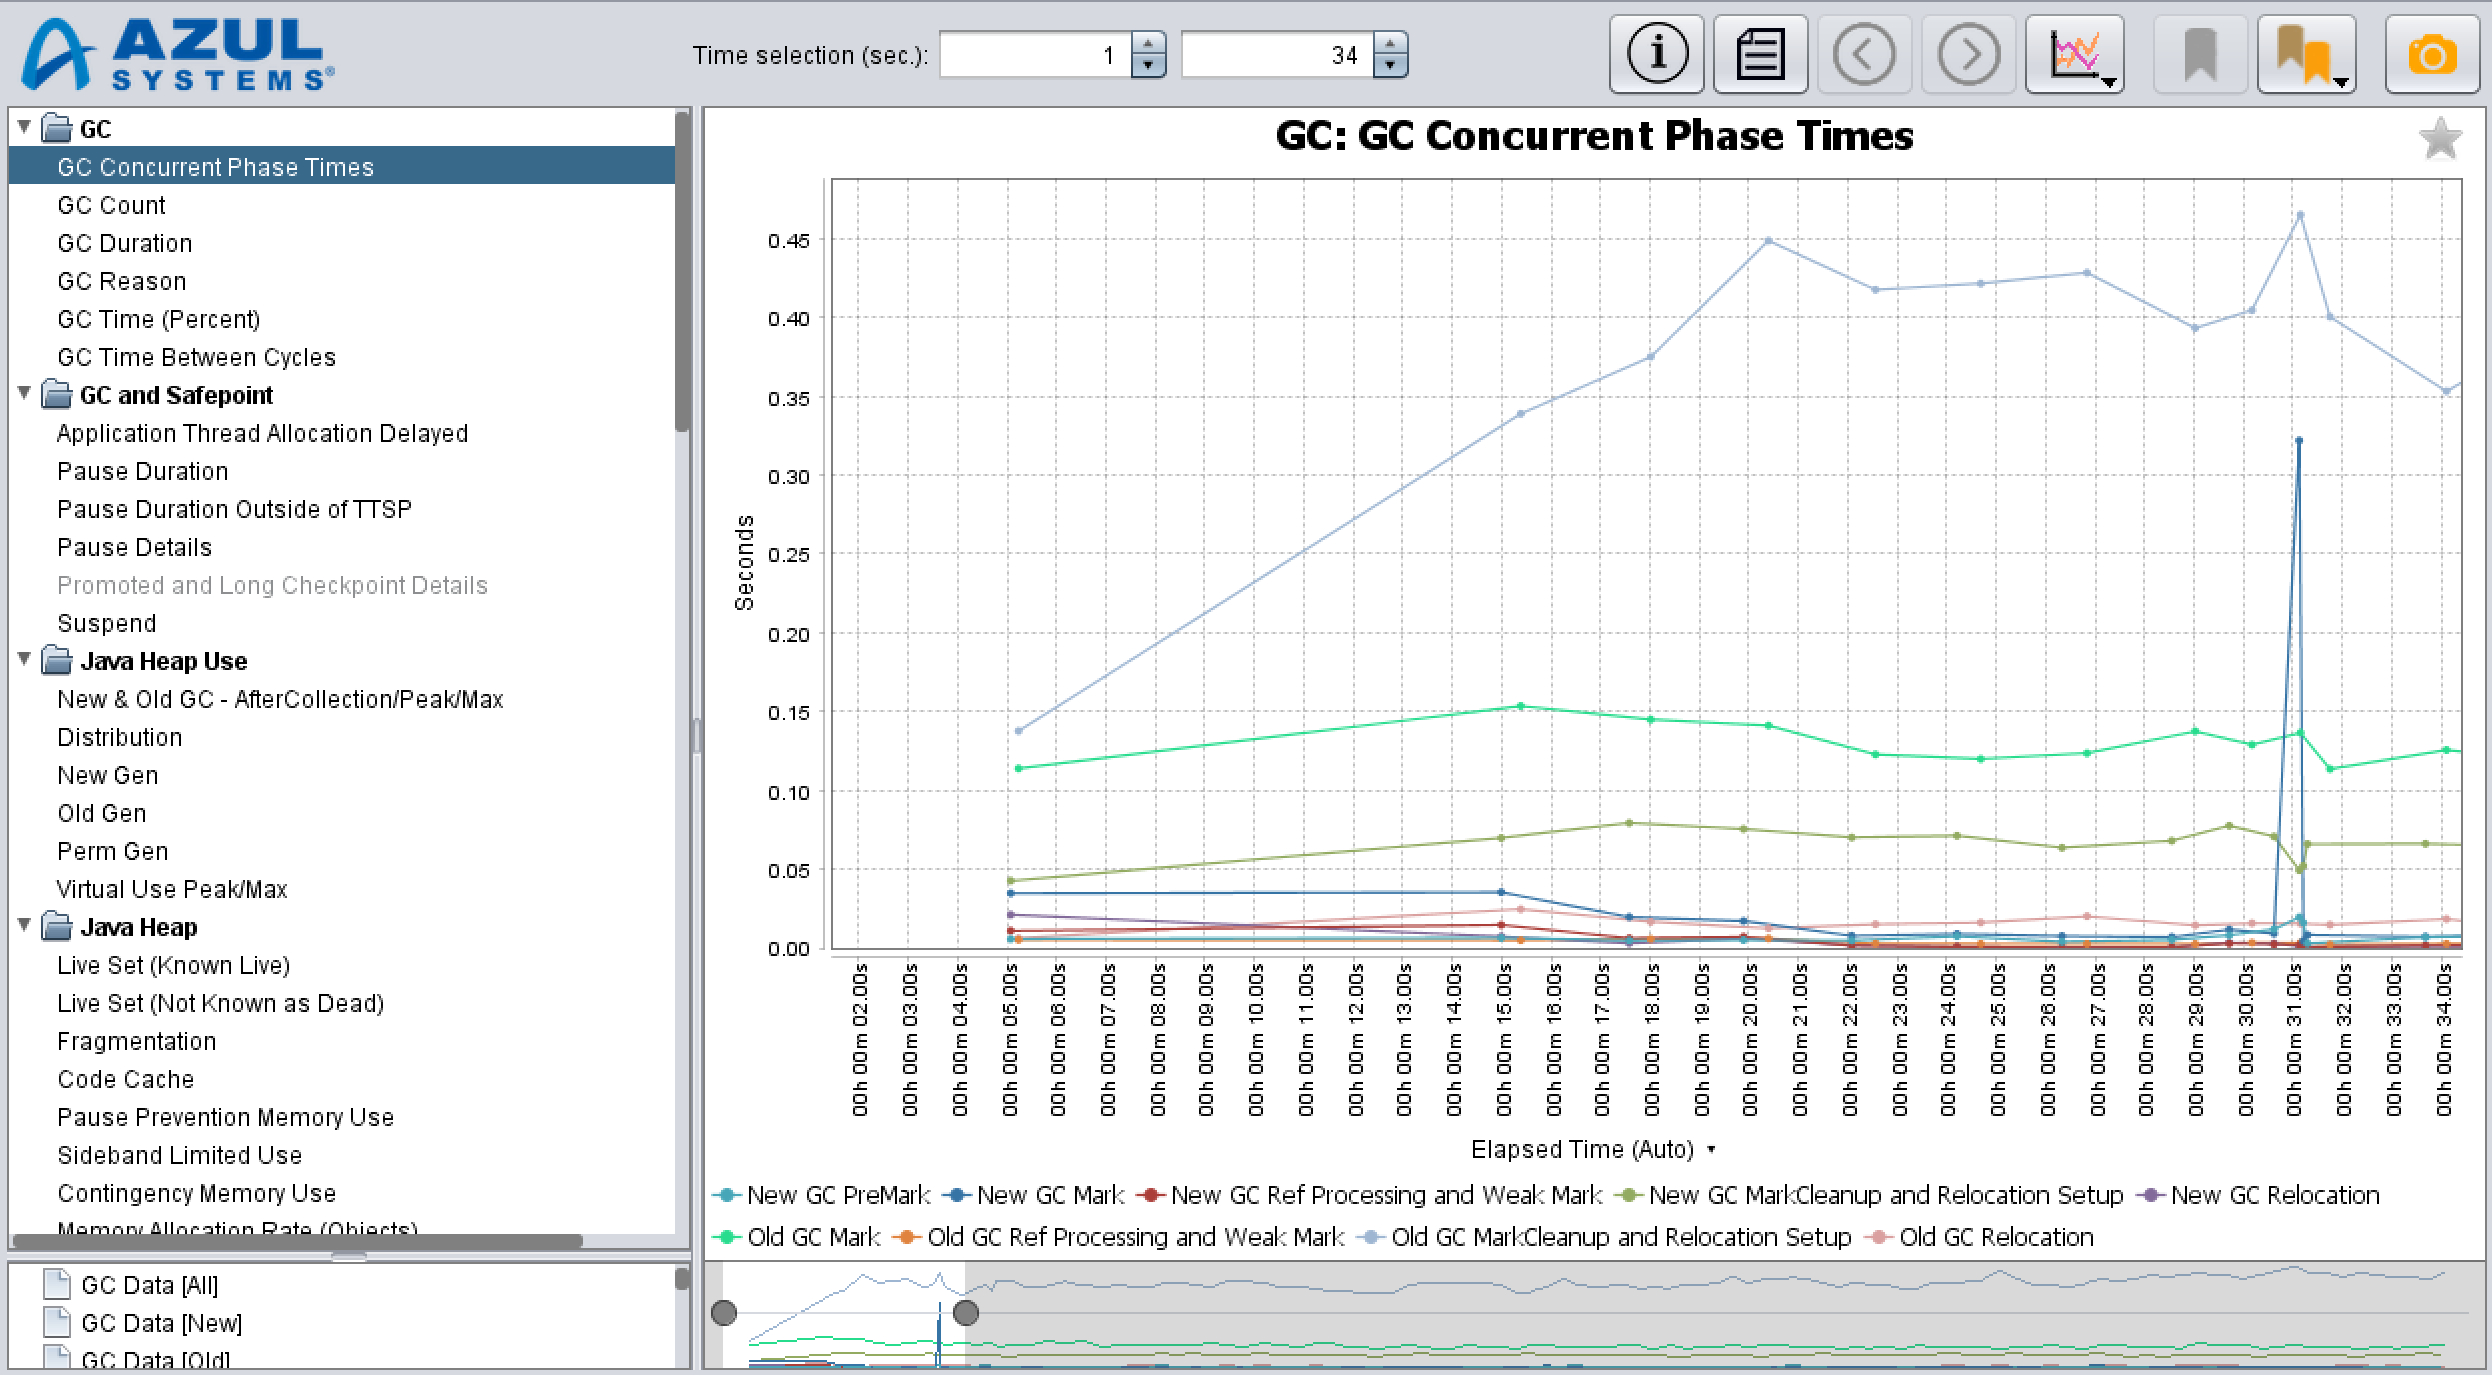
To reset zooming, click and drag your pointer in any other direction on the chart or double-click inside the selected portion of the timeline in the sliding bar.
Range Selection
To zoom in a specific time range of your graph, use a range slider below each chart to change a visible time frame. Dragging either of the slider handles represented by gray dots alters the beginning or the end of the visible time frame.
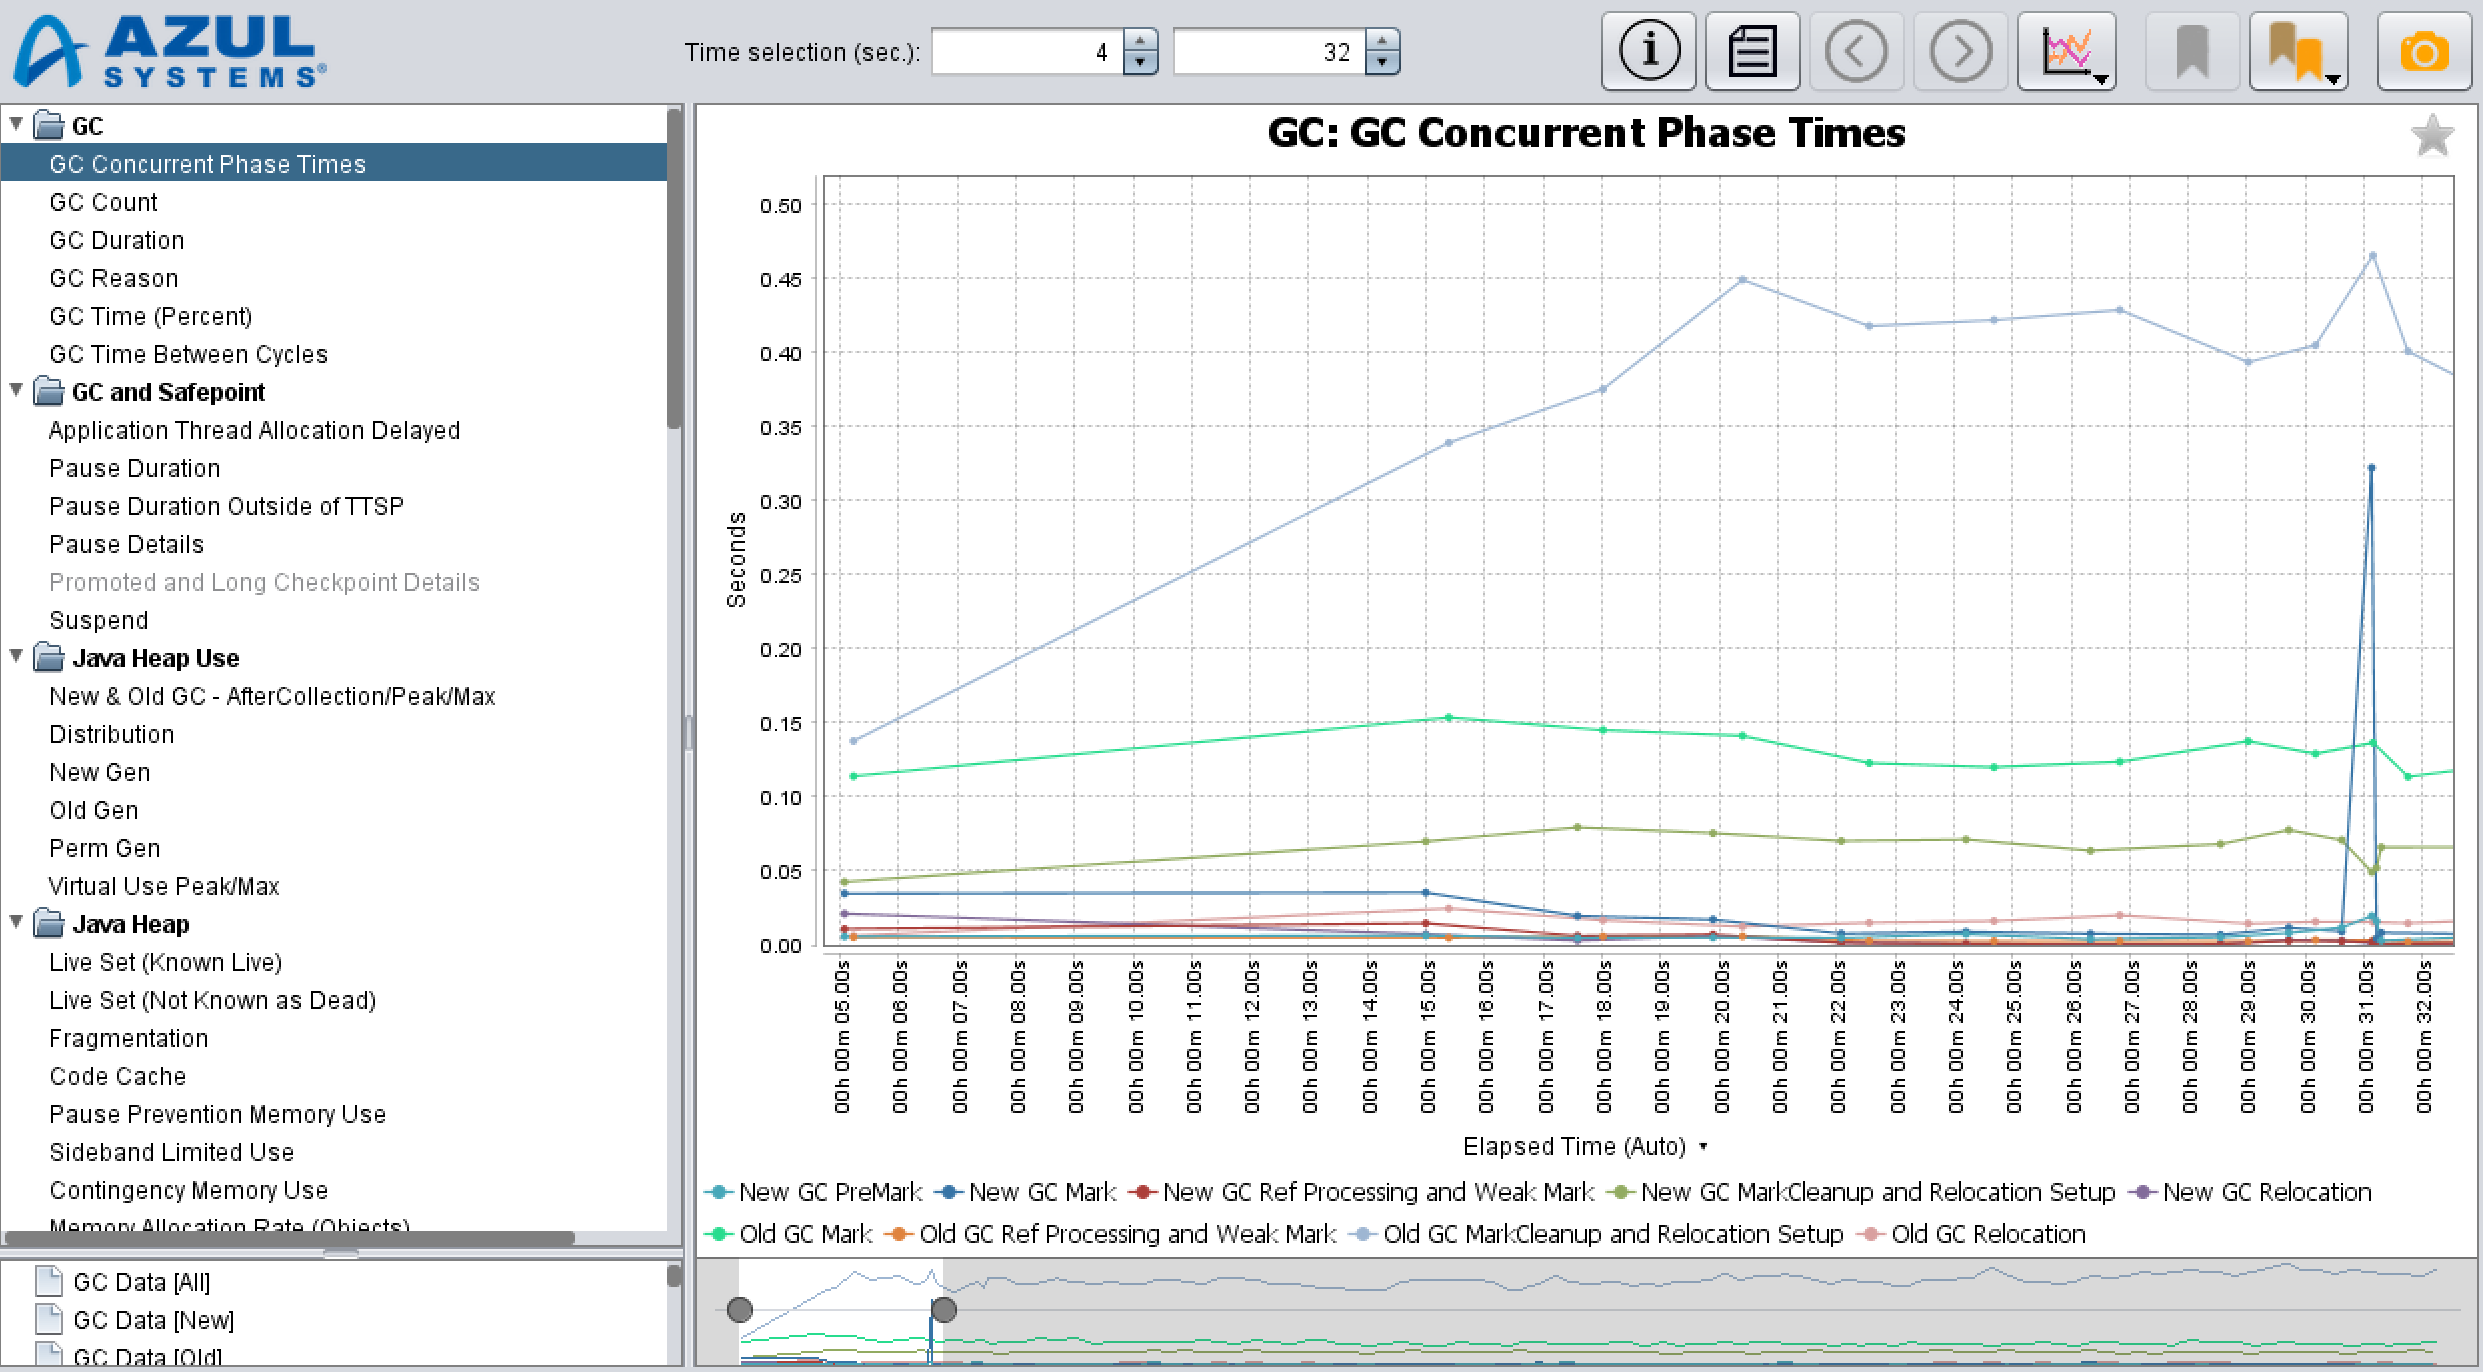
You can drag the center of the selected portion of the time line to the left or right to change the position of the enlarged time frame and keep the width of your selection.
Time Selection
To precisely set a specific time frame for viewing in a chart, specify the start and end seconds in the Time selection (sec.) fields of the toolbar.

Displaying Data in a Graph
A legend at the bottom of every graph describes the names and colors of each series of data included in the graph.

To display or hide a particular data series in the graph, toggle the items in the legend or use the Select Data Series button in the toolbar.
To display your preferred units for the time when a GC event started or time elapsed since the beginning of a GC log in the chart, select View > Time Units from the main menu or click a little upside-down black triangle above the graph legend. The GC Log Analyzer uses seconds as default time units.
Understanding a Garbage Collection Log Format
A garbage collection (GC) log is a text file with the collected and written metrics of the garbage collector’s work produced by the Java Virtual Machine (JVM). The GC Log Analyzer extracts various JVM and system metrics from GC logs.
Unlike logs produced by other JVMs, Zing GC logs contain detailed information not only about the GC process but about the system state as a whole.
GC logs can be very helpful in diagnosing CPU and memory-related issues, as well as in optimizing application performance.
GC log contents depend on the command-line options used to start Zing. Some details are available only when explicitly enabled with specific flags (see Garbage Collector Options in Using Zing Command-Line Options).
Zing uses an efficient, extendable text-based format to log events.
Detailed GC Logging
If detailed logging is enabled with -XX:+PrintGCDetails, very detailed and verbose information is printed to the log in a human-readable format that is NOT documented and can change at any time without notice.
A detailed GC log reading requires a deep understanding of Zing GC internals and is mostly intended for Azul engineers to use.
Regular GC Logging
The most common practice is to enable non-detailed GC logging with -XX:+PrintGC -XX:+PrintGCTimeStamps to minimize GC log file size, yet to get a lot of valuable information.
Zing writes GC logs very efficiently, so logging can be safely enabled even for low-latency production applications.
GC Log Format
The format of a GC log is universal. You do not need to know the whole range of possible fields to parse a log if you are familiar with the format.
Example 1. Zing GC log line format
<date>: <rel_time>: [<ID> <value> … ]
Where:
-
(optional)
<date>is an absolute time stamp of the logged event, enabled with-XX:+PrintGCDateStamps -
(optional)
<rel_time>is the time passed since the start of Zing in seconds, enabled with-XX:+PrintGCTimeStamps -
<ID>is the identifier of a line type, it defines how to interpret data that follows -
<value>is a set of data fields, separated with a space, colon, or both
Example 2. A GC log line
1.816: [OBJCREAT 33892 26764 18432 : 1.815713 ]
The meaning of fields can vary in different releases of Zing.
To associate a field with its meaning, read a header line for a particular type of the line.
Header lines are printed close to the beginning of the log and get replicated under some conditions (e.g., when GC log rotation is in use).
The format of the header line is very similar to the data line, except that <ID> is appended with the H letter followed by textual field names.
Example 3. A GC log header line
0.074: [OBJCREATH newGen(kB) permGen(kB) oldGen(kB) : end(s)]
Some headers consist of two consequent lines.
Example 4. A GC log two-line header
 0.074: [TAGH Group 1 Group 2 : AnotherGroup]
0.074: [TAGH field data data : data ]
In case of two header lines, the first line denotes groups and the second line denotes names. A combination of group + name is guaranteed to be unique within the same line type.
Unlike names, groups can contain spaces. Groups are divided by either a colon or two (or more) spaces.
Example 4 above defines the following three groups and four fields:
 Group 1/field
Group 1/data
Group 2/data
AnotherGroup/data
Although names of the fields can repeat (as shown in the example above), they are unique within the same line type in most cases. Names of the groups are guaranteed to be unique within the same line type.
Note how Group 2 is aligned with the second data field.
Below is a general rule for searching the index of a named field in a two-line header:
-
Find the group part of an ID in the first line.
-
Find the name part of an ID in the second line, starting from the position found in the first step.
Example 5. Matching groups and fields
 [ USEH memory disk ]
[ USEH min max min max ]
...
[ USE 10 20 30 40 ]
In Example 5, memory/min is the first data field (10), and disk/max is the fourth data field (40).
Many fields, but not all of them, are named so that it is clear what units they are reported in (e.g., cgMem_max_usage_bytes or oldGen(kB)).
Parsing GC Log Data
Please note that if you want to programmatically extract data from a Zing GC log, you cannot just grep for the line-type identifier and extract the N-th field.
The order and position of line fields can vary in different releases of Zing (e.g., a new field can be added to the middle of a log line).
To retrieve particular log data, check out GC log headers to find the position of a required field and retrieve data from a GC log line based on the field index in the particular log.
A script named gcLogScraper is provided along with the Zing installation (see Using Zing GC Log Scraper for details). The gcLogScraper script can be used to extract fields provided you know the fields names from a given log file.
GC Log Analyzer Command-Line Options
To display the list of command-line options available in GCLA (for example, for batch usage), run:
java -jar GCLogAnalyzer2.jar --help
Usage Recommendations
-
For big log files, consider increasing the size of the Java heap twice as much as the log file size. For example, if you have a 3 GB file, use -Xmx6g to start the GC Log Analyzer.
-
To open gc.log directly from the command line, run:
java -jar GCLogAnalyzer2.jar gc.log
Per-Thread CPU Utilization in GC Log
The per-thread CPU utilization tracking feature (available from Azul Zing 23.06.0.0) allows the collection and charting of per-thread CPU core usage statistics. This gives the ability to view the CPU usage of an application and JVM internal threads of the process over time. JVM internal threads are grouped into known categories (for example compiler or GC group) to make analysis of threads simpler. There is also an option to include CPU usage from other processes on the system.
Per-thread CPU utilization is turned on using the option -XX:+PrintCPUUtilization, which is disabled by default due to the potential overhead from data collection.
For options related to this feature, see Command Line Options.