Java Heap
The committed portion displays the Xmx value.
Native Memory Tracking (NMT) is an analysis tool which allows you to investigate internal memory usage of Java applications in Azul Zing Builds of OpenJDK (Zing). NMT is meant to be a temporary monitoring tool which allows you to monitor and diagnose memory-related issues within the JVM as it helps you to understand how the JVM allocates memory for various internal structures and other areas. NMT is helpful in determining if your increased memory usage is caused by any particular JVM component or by any native libraries hidden within your jar files.
To enable Native Memory Tracking, use the command-line option -XX:NativeMemoryTracking with summary or detail:
java -XX:NativeMemoryTracking=summary
To print out the statistics to stdout at the end of the run, add -XX:+PrintNMTStatistics:
java -XX:+PrintNMTStatistics -XX:NativeMemoryTracking=summary
Extended NMT covers most of the allocations inside libjvm.so. Compared to OpenJDK, which only provides HotSpot allocation coverage (inside libjvm.so), Zing provides full coverage of the malloc allocations in the process. On top of this, Zing 24.06.0.0+ provides coverage of memory allocated via mmap() from code outside libjvm. Extended NMT is enabled by default with NMT and requires no extra configuration.
Extended NMT is available from Zing 23.02.0.0. However, if you are using a Zing release from 23.02.0.0 and 23.06.0.0 or 23.02.400, you must use LD_PRELOAD to enable extended NMT by exporting `LD_PRELOAD in addition to the regular NMT flags as shown above.
export LD_PRELOAD=$JAVA_HOME/etc/zing/lib/libnmt_hooks.so
|
Note
|
The output formats and command line flags are identical for normal and extended NMT. |
When the LD_PRELOAD variable is exported, all Java processes run with extended NMT. As jcmd is also a Java process, jcmd gives the following output:
Detected libnmt_hooks.so in LD_PRELOAD. Adding implicit flag -XX:NativeMemoryTracking=summary for consistency. To avoid this warning enable NMT explicitly or remove libnmt_hooks.so from LD_PRELOAD.
This means jcmd itself is running with NMT-summary and this can be misleading.
|
Note
|
Only applications should be launched with LD_PRELOAD, not jcmd.
|
Use the following command to remove the exported 'LD_PRELOAD`:
unset LD_PRELOAD
Periodic NMT logging is a diagnostic feature available from Zing 24.08. With this feature, you can output NMT logs to the NMT output folder periodically. Since periodic NMT logging is a diagnostic feature, you must first unlock diagnostic VM Options using -XX:+UnlockDiagnosticVMOptions.
To specify the output directory for NMT logs, use -XX:PrintNMTStatisticsRoot=<dir_name>. Setting this option enables periodic dumping.
To specify the interval for printing the new report to the directory, use -XX:PrintNMTStatisticsAtIntervalSec=<interval in seconds>. The default value is 10 sec.
Example settings for periodic NMT logging:
java -XX:+UnlockDiagnosticVMOptions -XX:NativeMemoryTracking=summary -XX:PrintNMTStatisticsRoot=nmt -XX:PrintNMTStatisticsAtIntervalSec=20 Main
For tracking purposes, NMT puts 16 extra bytes before and 2 after every allocation. This is used for metadata and buffer overrun/underrun checks.
 +-----------+---------....---------+--------+
|  header   |         user         |   can  |
|           |      allocation      |   ary  |
+-----------+---------....---------+--------+
| 16 bytes  |       user size      | 2 byte |
The NMT summary report appears in several places:
In stdout of jcmd.
In stdout of the jvm, once at the end of the run in case if you passed -XX:+PrintNMTStatistics.
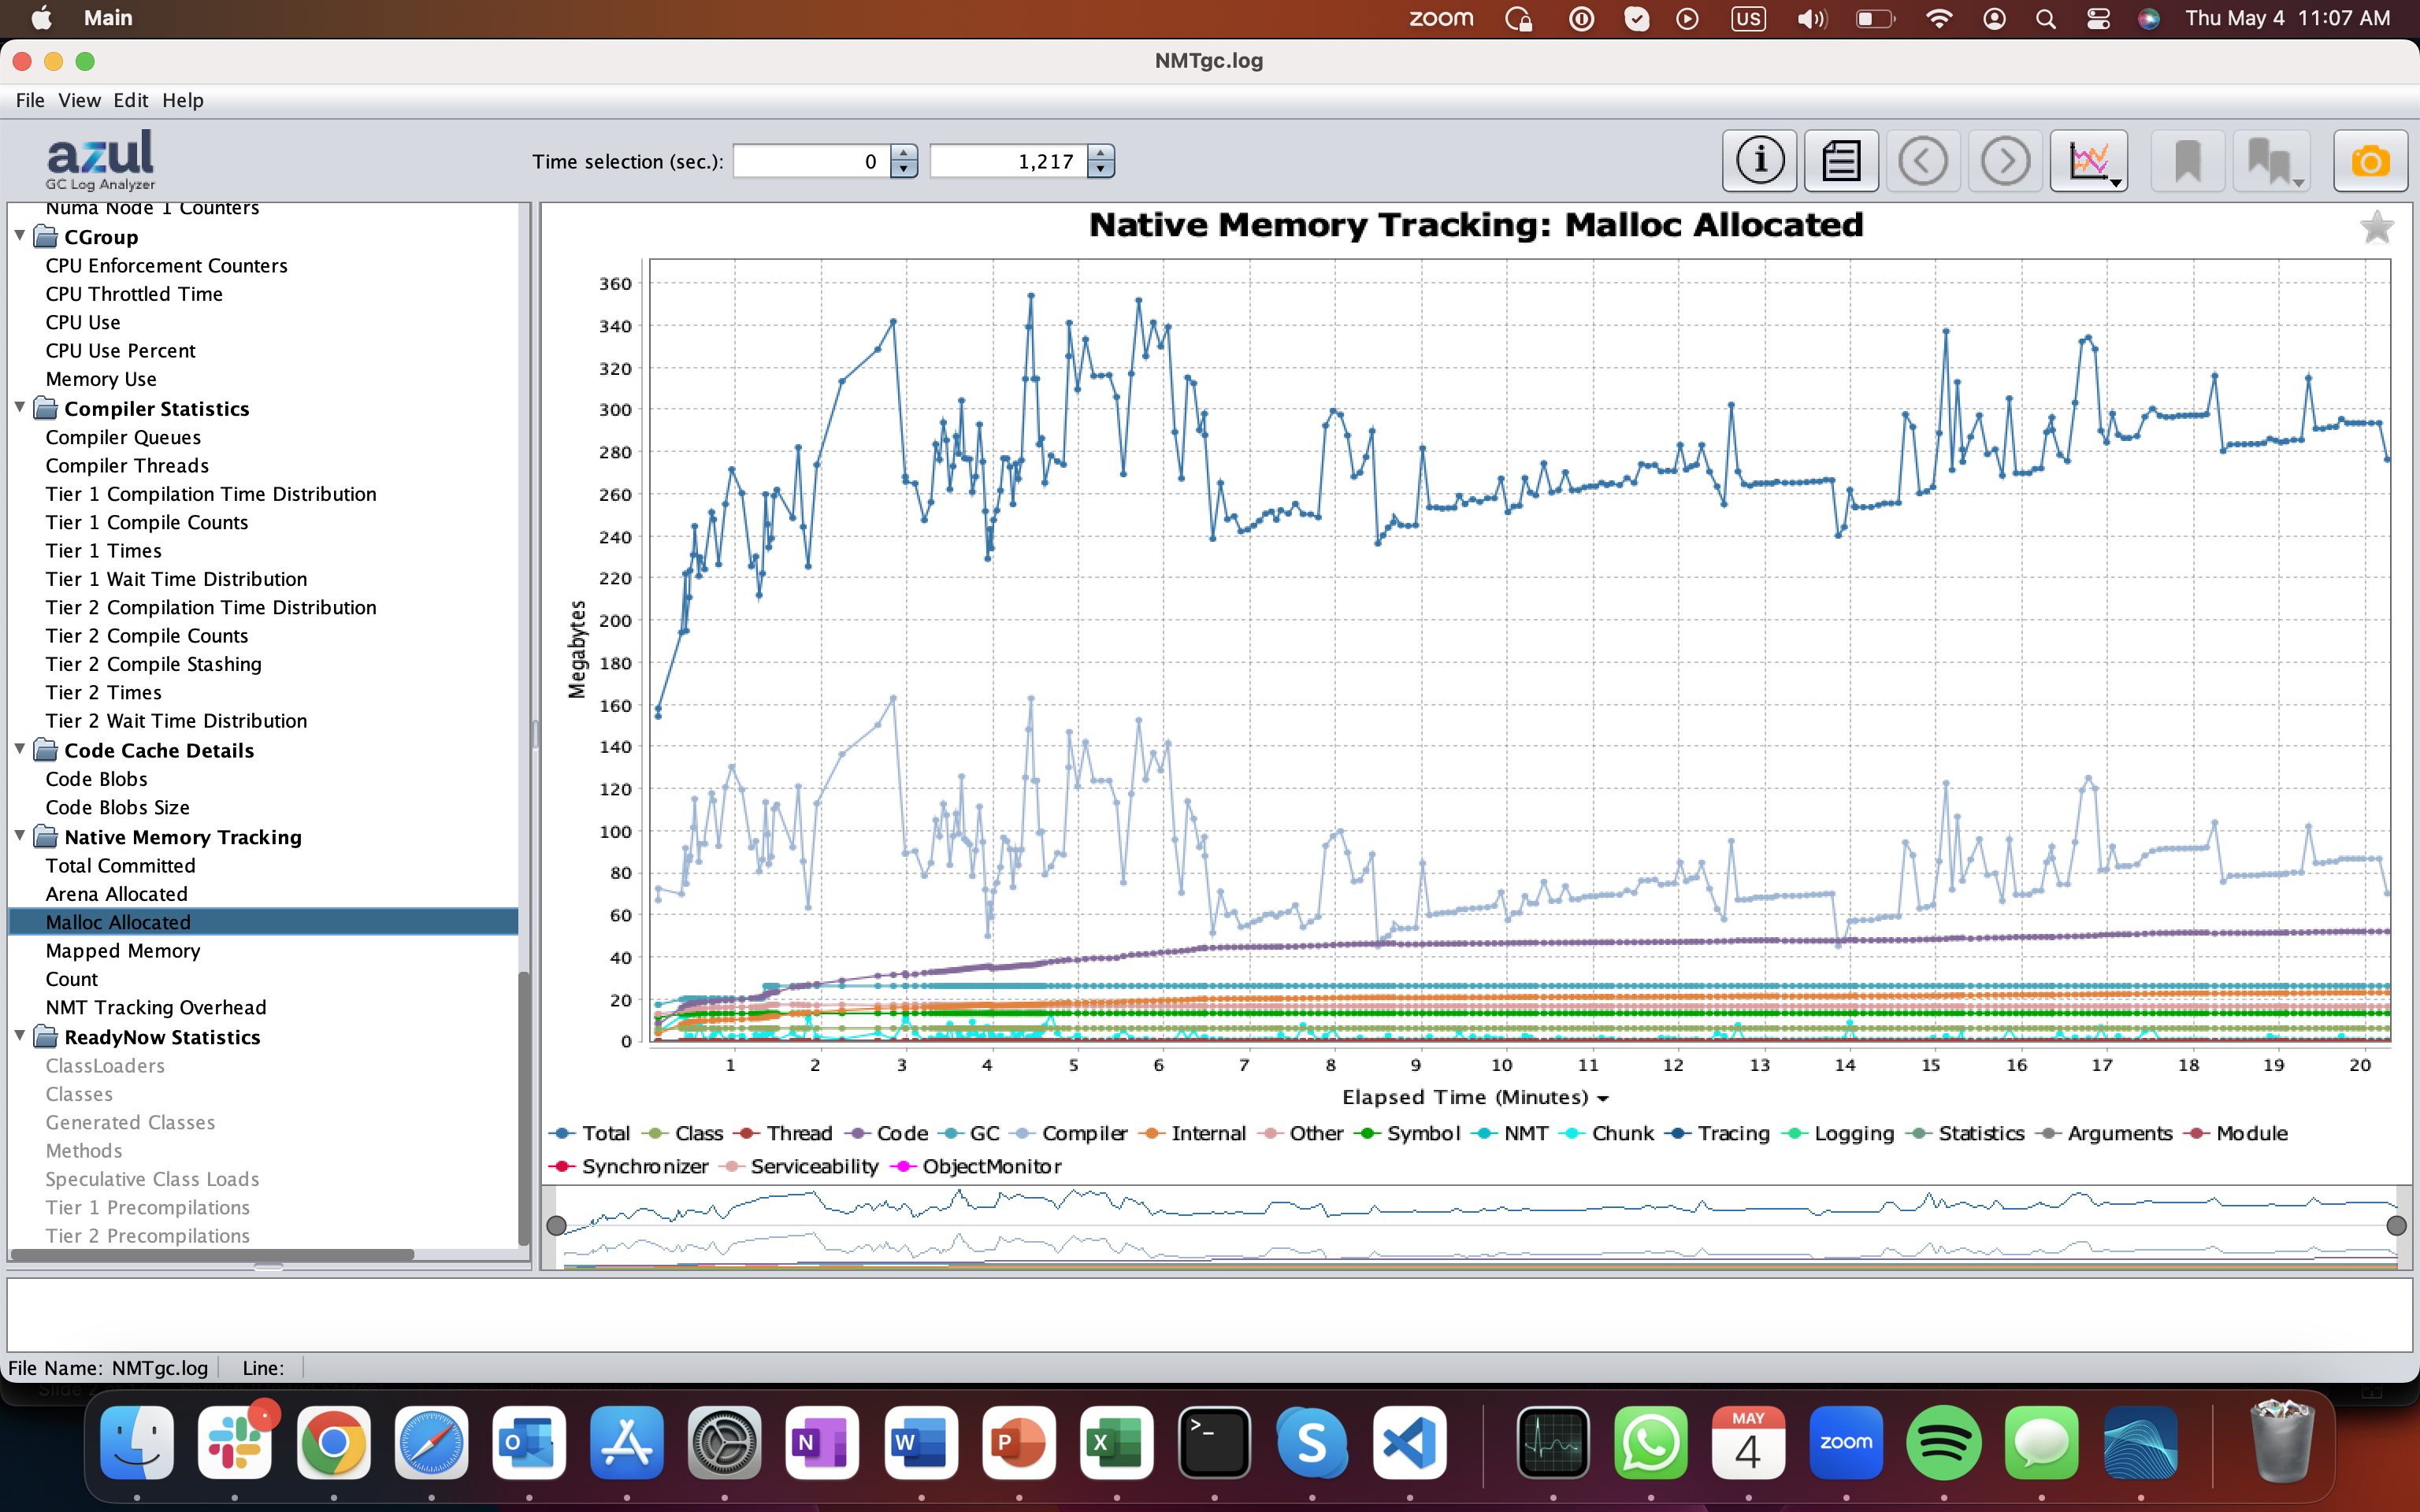
Periodically written in gclog if -Xlog:gc is used to start the application. For more information, check Unified Garbage Collection Logging Recommendations. An example of such gclog data is available in Analyzing in GCLogAnalyzer.
The summary level of tracking provides basic information about the following native memory allocations:
| Category | Amount of the native memory allocated for |
|---|---|
Java Heap |
Java Heap The committed portion displays the |
Class |
Application classes |
Thread |
Application threads |
Code |
Code being executed |
GC |
Garbage Collector |
Compiler |
Compiler operations |
Compiler Runtime |
Code profiles |
PersistentProfile |
ReadyNow |
Unsafe |
Unsafe API |
Internal |
Internal allocations |
Other |
Unsafe API without LD_PRELOAD It also contains all allocations from the process intercepted by the LD_PRELOADE library (except Falcon allocations going to Compiler). |
Symbol |
Table of symbols |
Native Memory Tracking |
Native Memory Tracking overhead |
Arena Chunk |
Arena-managed chunk |
Tracing |
Profilers (like TickProfiler and JFR) |
Logging |
Unified and other logging |
Arguments |
Processing arguments |
Module |
Managing Java modules |
Synchronization |
Synchronization primitives inside VM (like semaphores, monitors, mutexes) |
Unknown |
Unspecified allocations. You can expect to not see Unknown memory on any real reports. Unknown memory is only used internally. |
|
Note
|
If a given category has no allocations during the run, it is not listed in the report. |
|
Note
|
When the LD_PRELOAD variable is exported, more info is provided in the Compiler and Other category, resulting in bigger numbers.
|
 Native Memory Tracking:

Total: reserved=6517912398974, committed=1162447998
       malloc: 54123646 #27990
       mmap:   reserved=6517858275328, committed=1108324352

-                 Java Heap (reserved=1082331758592, committed=1052770304)
                            (mmap: reserved=1082331758592, committed=1052770304)

-                     Class (reserved=5221924, committed=5221924)
                            (classes #509)
                            (  instance classes #436, array classes #73)
                            (malloc=5221924 #27) (peak=5222596 #74)

-                    Thread (reserved=94458232, committed=2990456)
                            (threads #44)
                            (stack: reserved=94371840, committed=2904064)
                            (malloc=17512 #228) (peak=17688 #231)
                            (arena=68880 #70) (peak=461584 #2)

-                      Code (reserved=38538919, committed=38538919)
                            (malloc=4984487 #1244) (peak=9175117 #1173)
                            (mmap: reserved=33554432, committed=33554432)

-                        GC (reserved=5418119861538, committed=18765090)
                            (malloc=18617634 #383) (at peak)
                            (mmap: reserved=5418101243904, committed=147456)

-                  Compiler (reserved=16432737, committed=16432737)
                            (malloc=16150089 #15707) (at peak)
                            (arena=282648 #21) (peak=7496952 #27)

-          Compiler Runtime (reserved=104928, committed=104928)
                            (malloc=104928 #74) (peak=109316 #67)

-                  Internal (reserved=17297885663, committed=19487199)
                            (malloc=539103 #4735) (peak=541123 #4751)
                            (mmap: reserved=17297346560, committed=18948096)

-                     Other (reserved=167361, committed=167361)
                            (malloc=167361 #499) (peak=169137 #503)

-                    Symbol (reserved=5945016, committed=5945016)
                            (malloc=5945016 #47) (at peak)

-    Native Memory Tracking (reserved=774976, committed=774976)
                            (malloc=327120 #3738) (peak=327208 #3739)
                            (tracking overhead=447856)

-               Arena Chunk (reserved=1117320, committed=1117320)
                            (malloc=1117320 #116) (peak=7758400 #121)

-                   Tracing (reserved=2320, committed=2320)
                            (malloc=2320 #7) (at peak)

-                   Logging (reserved=5004, committed=5004)
                            (malloc=5004 #210) (at peak)

-                 Arguments (reserved=7426, committed=7426)
                            (malloc=7426 #124) (at peak)

-                    Module (reserved=69576, committed=69576)
                            (malloc=69576 #208) (at peak)

-           Synchronization (reserved=47360, committed=47360)
                            (malloc=47360 #639) (peak=47544 #641)

-            Serviceability (reserved=82, committed=82)
                            (malloc=82 #4) (at peak)
When the LD_PRELOAD variable is not exported, this report starts with the following message:
 Info: To make this report more precise add
  "export LD_PRELOAD=$JAVA_HOME/etc/zing/lib/libnmt_hooks.so"
  to the environment of Azul Prime JVM.
The detail level of tracking provides the same output as the summary level, but adds a per-call site report with stack traces and info about mmaps (reserved regions and committed memory inside them).
 Native Memory Tracking:

Total: reserved=6517912398974, committed=1162447998
       malloc: 54123646 #27990
       mmap:   reserved=6517858275328, committed=1108324352

-                 Java Heap (reserved=1082331758592, committed=1052770304)
                            (mmap: reserved=1082331758592, committed=1052770304)

# ... other categories identical to summary report

Virtual memory map:

[0x0000691d00000000 - 0x00006e0000000000] reserved 5373004087296 for GC from
[0x00007ff717f4b053] GPGC_Heap::setup_memory_for_java_heap_structures()+0x53
[0x00007ff717f4f63f] GPGC_Heap::initialize()+0x7bf
[0x00007ff7186dd57a] Universe::initialize_heap()+0x3a
[0x00007ff7186dd702] universe_init()+0x102

[0x00007ff49717b000 - 0x00007ff49737b000] reserved 2097152 for Thread Stack from
[0x00007ff718a712e5] JavaThread::run()+0x25
[0x00007ff718c69300] _start_thread+0x100
[0x00007ff71b236cd6] preRun+0x4f
[0x00007ff71ac36ea5] start_thread+0xc5

	[0x00007ff49717b000 - 0x00007ff497194000] committed 102400 from
            [0x00007ff718c7d01c] os::create_stack_guard_pages(char*, unsigned long)+0x5c
            [0x00007ff718a51991] Thread::create_stack_guard_pages()+0x91
            [0x00007ff718a712fe] JavaThread::run()+0x3e
            [0x00007ff718c69300] _start_thread+0x100

	[0x00007ff497379000 - 0x00007ff49737b000] committed 8192

[0x00007ff717dc4e86] debuginfo::builder::ScopeBuilder::make_compressed(CommonAsm*, GrowableArray<long>*)+0x3c6
[0x00007ff717dc9f5a] debuginfo::builder::DebugMapBuilder::build_debugMap(CommonAsm*)+0xf5a
[0x00007ff717dca3c6] CommonAsm::bake_into_codeOop(methodHandle, int, CodeProfile const*, bool, osr_bci_list&&, Thread*)+0x206
[0x00007ff718248927] ciEnv::register_method(ciMethod*, MacroAssembler*, CodeProfile**, ByteSize, Label&, bool, GrowableArray<int> const&)+0x267
                             (malloc=10440 type=Code #145)

[0x00007ff718b6d9b0] BasicHashtable<(MEMFLAGS)1>::new_entry(unsigned int)+0x70
[0x00007ff718b6e111] Hashtable<klassOopDesc*, (MEMFLAGS)1>::new_entry(unsigned int, klassOopDesc*)+0x11
[0x00007ff7182fde23] Dictionary::new_entry(unsigned int, klassOopDesc*, oopDesc*)+0x23
[0x00007ff7182fe2ea] Dictionary::add_klass(symbolHandle, Handle, KlassHandle)+0x12a
                             (malloc=44000 type=Class #1)

[0x00007ff717f24551] GPGC_GCManagerNewStrong::initialize()+0x351
[0x00007ff717f48c05] GPGC_Heap::post_initialize()+0x45
[0x00007ff7186e1d15] universe_post_init()+0x1c15
[0x00007ff7189a2a15] init_globals()+0xd5
                             (malloc=6912 type=GC #18)
...
When your application is running (after warmup of the application), you can set a baseline of native memory usage. When you have established this baseline, you can request a diff at any time to compare your current native memory usage with your baseline. This is a useful way to detect any memory leaks.
To set a baseline, use:
jcmd <pid> VM.native_memory baseline
To perform a diff at summary level, use:
jcmd <pid> VM.native_memory summary.diff
To perform a diff at detail level, use:
jcmd <pid> VM.native_memory detail.diff
Use the GC Log Analyzer to visualize and plot the NMT results for both normal and extended modes.