Using jHiccup
jHiccup measures the pauses that could affect a running application. The source of the pauses could be from the JVM (Java Virtual Machine) runtime or operating system events. If we can rule out the operating system events then we can measure the JVM runtime-caused pauses that might impact the response times of running applications.
How Does jHiccup Work?
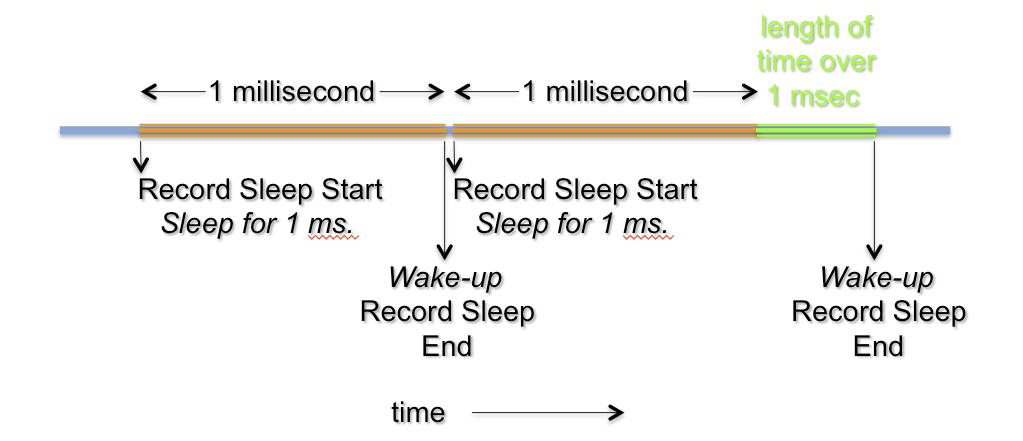
jHiccup starts a thread that records the time interval since it last went to sleep.
The thread sleeps for 1 millisecond (default, configurable) and then wakes up, records the time since it last went to sleep that is greater than 1 millisecond and repeats.
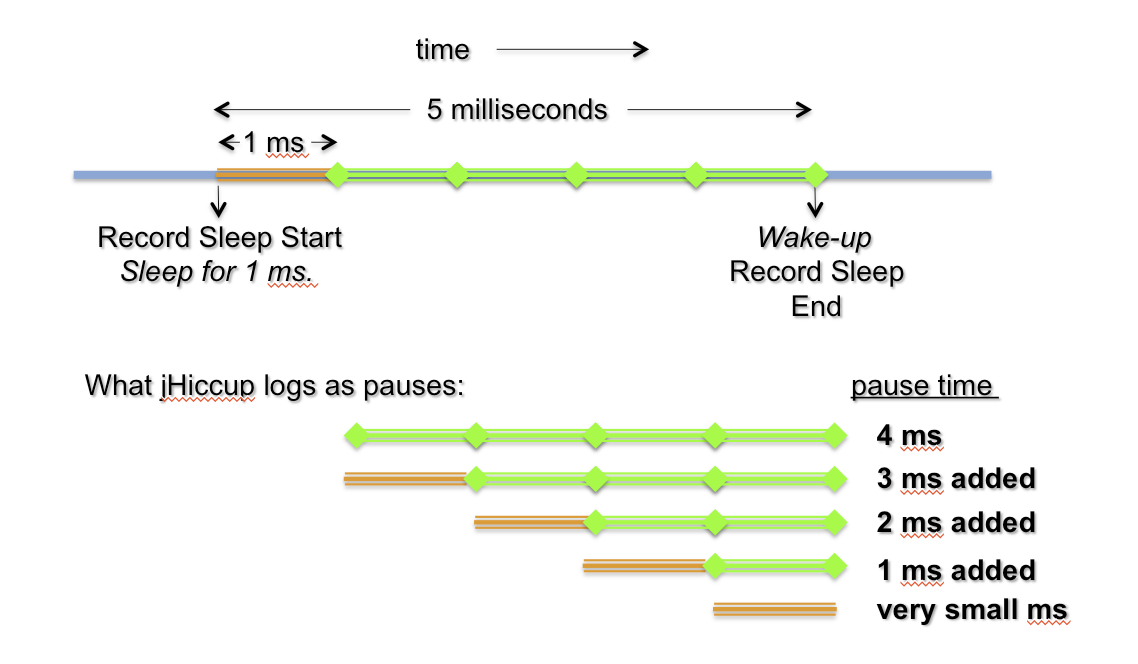
In the diagram, jHiccup measures the length of time greater than 1 millisecond. This is the measured delay. If the measured delay is greater than 1 millisecond then jHiccup creates additional pauses to account for those that it missed. The following example shows the four additional pauses added when a 5 millisecond pause occurs. Together, all of these pauses are the hiccups.
Generating jHiccup Log Files
To understand the impact of JVM runtime pauses, follow this example of the process of collecting and evaluating the jHiccup data.
-
Install and configure the application you wish to test. For this example, you can use a test in the DaCapo benchmark suite. This suite is intended as a tool for Java benchmarking and consists of a set of open source applications with non-trivial workloads. The benchmark suite can be downloaded from dacapobench.org.
In this example, we use the h2 benchmark test from version
23.11-MR2-chopin. It’s a JDBCbench-like in-memory benchmark that executes transactions against a model of bank data. The benchmark is run using the following command:java -Xmx8g -jar dacapo-23.11-MR2-chopin.jar -n 20 h2This command will perform twenty iterations of the benchmark ensuring that it runs long enough to exercise the JVM at an acceptable level. When monitoring your own application you should select a configuration and length of time that will give throughput results representative of those you obtain in your production environment.
-
Download the jHiccup application and obtain more details about jHiccup at: https://www.azul.com/products/components/jhiccup/. Extract the archive in a suitable directory. Version-specific information is available in the accompanying README file.
-
jHiccup can be used in one of three ways:
-
Start as a Java agent (recommended)
-
java -javaagent:<path-to-jar>/jHiccup.jar java-application
-
-
Use the environment variable
_JAVA_OPTIONSin a complex environment:-
export _JAVA_OPTIONS=-javaagent:<path-to-jar>/jHiccup.jar
-
-
Start application using jHiccup shell script
-
jHiccup java-application
-
-
-
Determine which is the best approach for your application. Typically, you will modify your application startup script to use one of the two methods. For our example, we will use the third method, so our command line becomes:
./jHiccup $JAVA_HOME/bin/java -Xmx8g -jar dacapo-23.11-MR2-chopin.jar -n 20 h2If you are using the Oracle JDK, add
-XX:+UseG1GC. -
You will need to run this test twice. For the first run, use your existing Java runtime (set via the
JAVA_HOMEenvironment variable or directly in your application startup script). For the second run, use the Azul Zing Builds of OpenJDK (Zing) by changing yourJAVA_HOMEenvironment variable and/or startup script appropriately. You will now have two histogram log (hlog) files with names of the form:hiccup.<date>.<time>.<sub-second-time>.hlog
Comparing JVM Runtime Pause Performance
Now that we have created the histogram log files for both JVMs, we need a way to display the data. Azul created the HistogramLogAnalyzer tool to graph the results contained in one or more log files.
-
Download a tar.gz or zip archive with the HistogramLogAnalyzer tool. Extract the archive in a suitable directory. Alternatively, you can download a source code from https://github.com/HdrHistogram/HistogramLogAnalyzer and build the tool.
-
Start HistogramLogAnalyzer:
java -jar HistogramLogAnalyzer-1.0.3.jar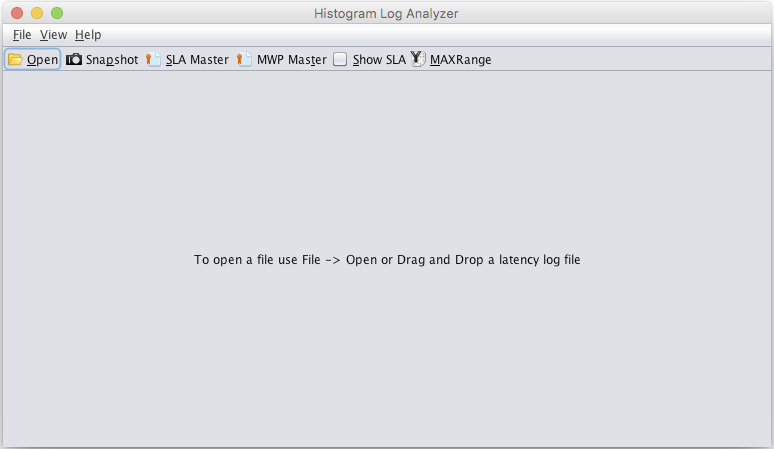
-
You can also start the tool using the command line option, -f, to automatically open a file:
java -jar HistogramLogAnalyzer-1.0.3.jar -f file-name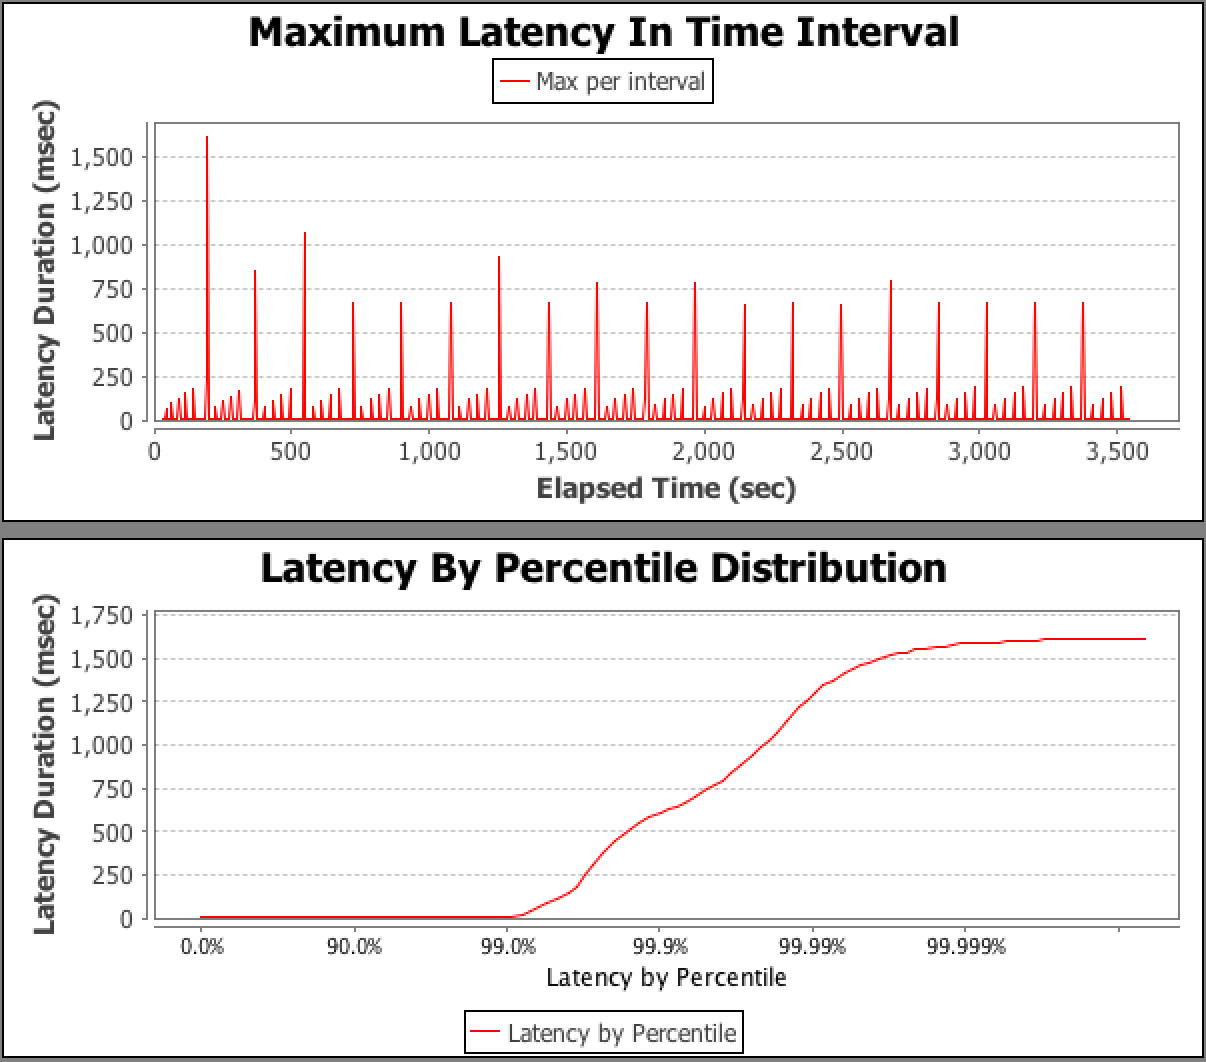
-
Following the example, click Open in the window, and navigate to the directory where your hlog files are located First select the log file generated using the Oracle HotSpot JVM. This will display the following two graphs:
Upper Graph – Maximum Latency (Hiccups in this case) In Time Interval
The upper graph shows the maximum hiccup for each time interval (5 seconds by default) as the application ran. The x-axis is the elapsed execution time for the application. The y-axis represents the maximum duration of hiccups in a given interval. These are the maximum pauses for the interval that an end user would experience when using the application. The pattern of the hiccups suggests that garbage collections have a significant impact on pause/hiccup durations – a series of pauses for minor collections followed by a longer pause for a major collection.
Lower Graph – Latency (Hiccups) by Percentile Distribution
The lower graph shows the hiccup times for the application in percentiles. Use this graph to assess whether your application meets a defined service level agreement (SLA) for response times.
SLAs are frequently specified in the form, “this application must respond within 20 milliseconds 99.99% of the time”. An application with this SLA could have a single pause of 100 milliseconds during its run of several hours. For that case, despite the maximum pause being significantly longer than the required SLA maximum, it does not do so more than 0.01% of the time. However, if there are frequent pauses of 30 milliseconds this could break the SLA.
The lower graph makes it easy to see the percentile at which the application goes above a certain threshold. In the graph, the 99.99th percentile is 1250 milliseconds.
Comparing Hiccup Files
For comparison, we can add a second set of data in a file generated using Zing. Again, click on Open, navigate, if necessary, to the directory containing the histogram log file generated using Zing and select it. A pop-up dialog box will ask you if you want to open this log in the same tab. Select ‘yes’. The tool will now display the following:
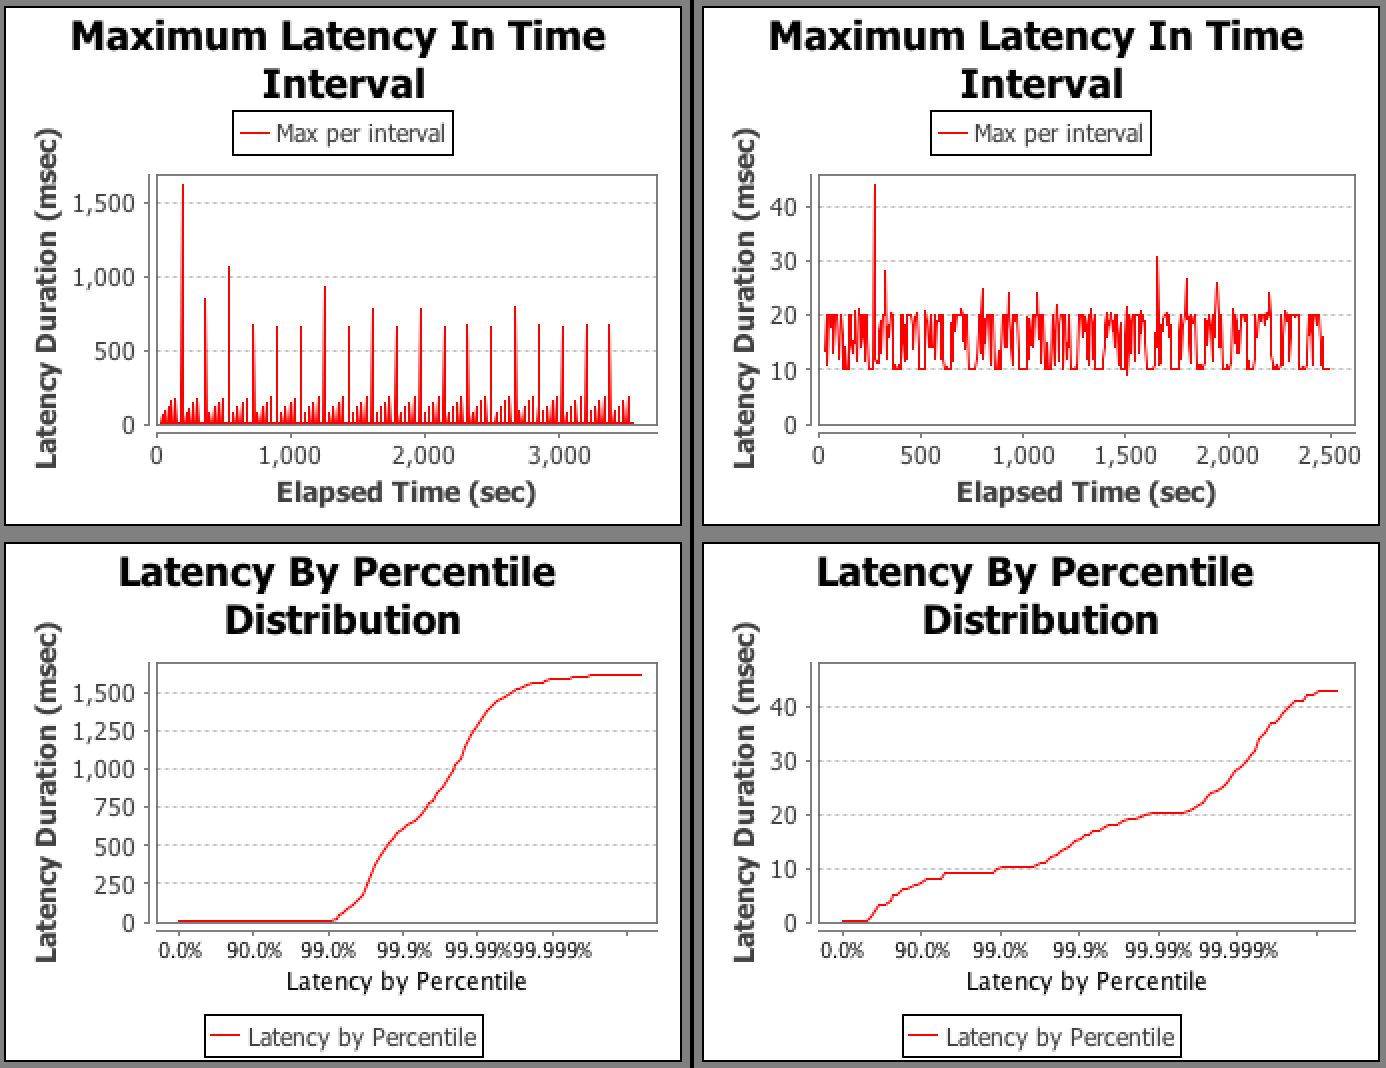
This provides an easy way to compare hiccup times when your application is run using your current JVM and the Zing. Clearly, the hiccups measured when running Zing are shorter, with a maximum hiccup of 43 milliseconds and a 99.99th percentile of 20 milliseconds.
The following table compares the two JVMs.
| JVM | 99.99th Percentile (ms) | Maximum Hiccup (ms) |
|---|---|---|
Oracle HotSpot |
1250 |
1600 |
Azul Zing JVM |
20 |
43 |
Setting the Y-Axis Range of Values
One important thing to note is the range of values on the y-axis for the graphs may not be the same, as is the case with these graphs. Although Zing’s Maximum Latency (Hiccup) graph appears to have equally long pauses, the range of values for the y-axis is much smaller for Zing’s data. The same applies to the percentile graphs. To get an accurate visual comparison select the View → Normalize Y Axis menu item in the menu bar.
All the graphs will have the same range for their y-axes as shown below:
The benefits of Zing now become clear.
jHiccup Command-Line Arguments
Below are the command-line options used to control jHiccup behavior and reporting. The command-line options are separated by commas instead of spaces for easier embedding the –javaagent option to existing start scripts, for example:
-javaagent:/opt/zing/jHiccup.jar=-i,1000,-l,/tmp/hiccup.log
Details of the options to use with the jHiccup Java agent that runs in the same process as the application:
| Option | Description |
|---|---|
[-h] |
help |
[-l logFileName] |
Logs hiccup information into logFileName.hlog (will automatically replace occurrences of %pid and %date in the file name with appropriate information). |
[-d startDelayMs] |
Delays the beginning of hiccup measurement by startDelayMs milliseconds (default 30000). |
[-i reportingIntervalMs] |
Sets reporting interval (default 5000). |
[-r resolutionMs] |
Sets sampling resolution in milliseconds (default 1). |
[-t runTimeMs] |
Limits measurement time (default 0, == infinite). |
Details of the options to use to launch a separate JVM process on the same machine that runs the jHiccup Java agent and collects information about the operating system and hardware’s impact on pauses:
| Option | Description |
|---|---|
[-c] |
Launches a control process in a separate JVM logging hiccup data into logFileName.c.hlog. |
[-x controlProcessArgs] |
Passes additional arguments to the control process JVM. |
[-terminateWithStdInput] |
Takes over standard input, and terminates process when standard input is severed (useful for control processes that wish to terminate when their launching parent does). |