What To Expect When Evaluating Azul Prime Performance
If you’re evaluating Azul Prime, then you likely already have a Java application in production and are interested in comparing how that application runs on Azul Prime instead of your current Java runtime. This page lists what to expect when running your program on Azul Prime and comparing it to other OpenJDK-based runtimes.
As a refresher, Azul Prime contains several key elements:
-
Azul Zing Builds of OpenJDK (Zing) - a highly optimized build of the OpenJDK runtime that replaces key pieces of JVM infrastructure like the garbage collector and the JIT compiler with optimized Azul versions of these components.
-
Azul Zing System Tools (ZST) - a separate and optional component for older Linux kernels to coordinate memory usage. For newer Linux kernels, Zing should be configured using Transparent Huge Pages (THP) for memory coordination. To learn more about THP, see our documentation on setting up THP.
-
Azul Mission Control and other diagnostic tools.
It’s the Same
You do not need to recompile your code or make any changes to your current deployment mechanism. Zing is based on OpenJDK and is TCK-tested and Java SE compliant. As such, there are no functional differences between running your code on Azul Zing and any other OpenJDK runtime.
To switch to Zing, simply install it and change your JAVA_HOME. You don’t need to change any of your Java startup flags or your OS environment.
But It’s Different
Zing replaces several key components of OpenJDK with enhanced versions. This can lead to profound performance improvements in JVM behavior, such as eventual code speed and response latency. It also leads to differences in things like memory usage, warm-up, and configuration flags. Here are some of the main areas where Zing differs.
Garbage Collection
One key benefit of Azul Prime is the default garbage collector, called C4. Traditional Java garbage collectors like Parallel GC and G1 require stop-the-world pauses where the entire application pauses while garbage collection occurs. The higher your heap and the more objects that need collecting, the longer these stop-the-world pauses take. This leads to higher latencies and inconsistent transaction performance, making it especially difficult to meet SLAs.
The Zing C4 Garbage Collector uses a 4 stage concurrent execution mechanism that eliminates almost all stop-the-world pauses. This lets your application continue executing while garbage collection is ongoing. When testing your application under real-world conditions, you will see reduced latencies across all percentiles and especially elimination of large outliers in latency.
|
Note
|
The benefits of C4 will only be visible if you test real applications under real-world conditions. Running a microbenchmark for ten minutes is not likely to generate any garbage collection activity, and even running your full app in an isolated test environment with a synthetic workload often produces limited garbage collector activity. To see the true value of C4, it’s always best to perform a test in your production environment with actual real-world traffic. |
Memory Usage
Because larger Java heaps create longer stop-the-world garbage collection pauses, many people keep the Java heap low and scale horizontally. Zing minimizes stop-the-world garbage collection pauses, so you can use larger heaps without worrying about incurring high response latency during garbage collection operations. Where it makes sense, try raising your heap size within the limits of the physically available memory. Note that paging should always be avoided.
|
Note
|
The internals of JVM memory management for Azul Prime differ from other JVMs. This results in different heap and native memory usage. |
Unlike OpenJDK, Zing doesn’t have metaspace where it stores some objects. Zing stores everything as ordinary Java objects in the Java heap. This practice simplifies heap management, since storing additional objects in the metaspace can lead to PermGen OOM errors. If you are comparing performance between OpenJDK and Zing, be aware that Zing is doing more in its Java heap than OpenJDK.
Zing has no Compressed OOPs, which means all pointers are 64bit pointers. On memory-constrained environments, this can cause differences in application performance.
Generally, pauseless garbage collectors like Zing’s C4 and OpenJDK’s ZGC/Shenandoah consume more heap than OpenJDK (when using traditional stop-the-world garbage collectors). Monitoring solutions that rely on JMX Beans can report memory usage for pauseless garbage collectors differently, and often incorrectly. See JMX Beans section below.
Optimized Code Speed and Carrying Capacity
Zing replaces the Hotspot JIT compiler in OpenJDK with the Falcon JIT compiler. Falcon produces faster end-state code than Hotspot. You should see increased throughput and carrying capacity for each of your VMs, which has the side effect of being able to serve the same amount of traffic from a smaller number of VMs.
Warm-up Time
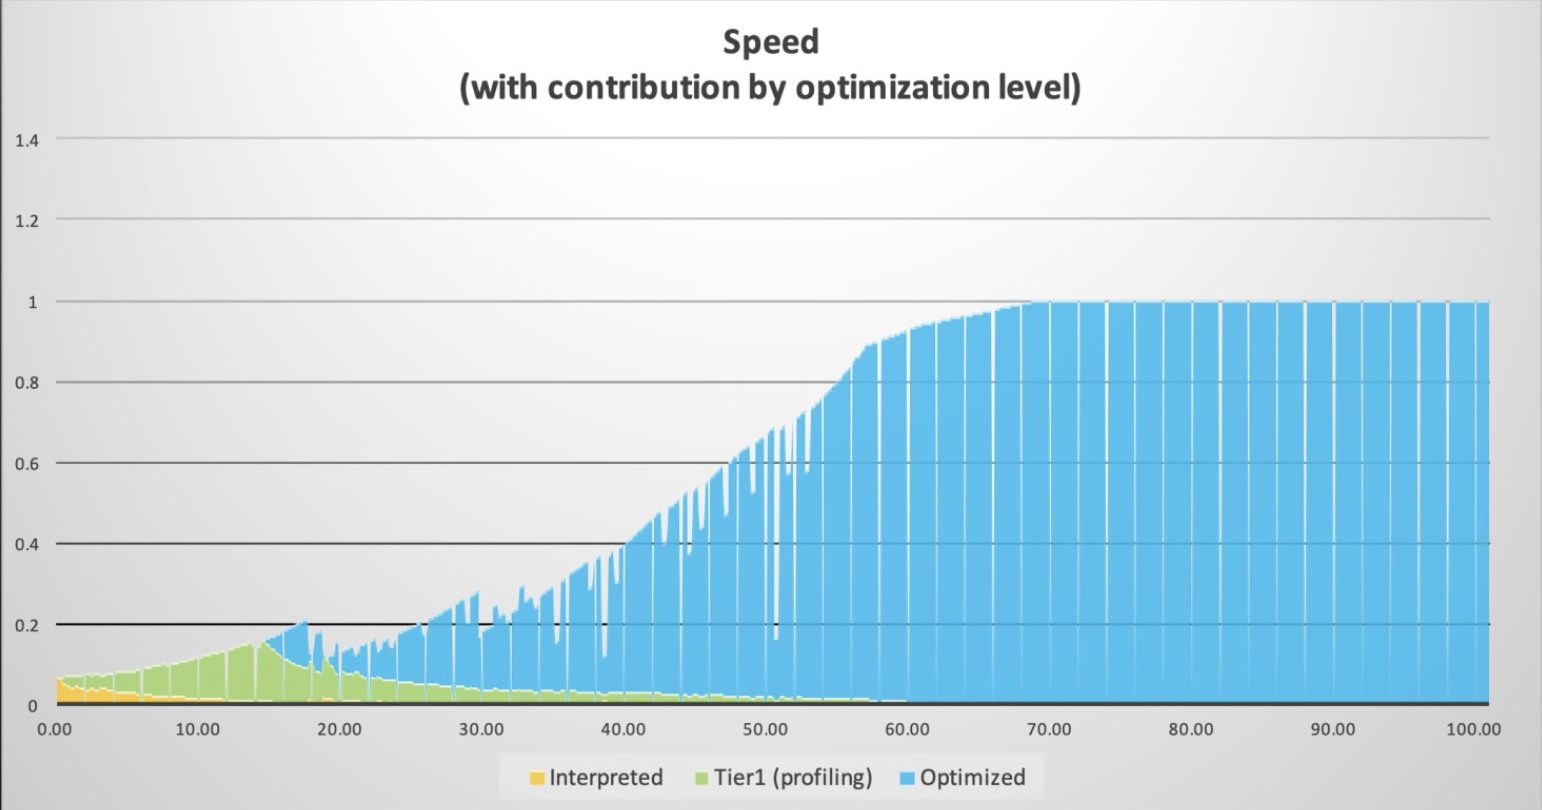
With all modern JVMs, when you start an application, there is a "warm-up" period where the application runs slower while the code is optimized and all of the post-initialization tasks of your application complete. You can see the effect of this by, for example, looking at the throughput of your tests and seeing when the throughput stabilizes. When starting the application, throughput often has a curve that looks like this while warming up.
Zing’s Falcon JIT compiler has different optimization levels that produce different speeds of the resulting code. The higher optimization levels that produce the fastest code come with higher upfront costs, which can take the form of longer warm-up periods with higher CPU loads.
By default, Azul Prime optimizes for speed, meaning we apply use a very high tier of optimizations by default. In cases where this causes too long or expensive warm-up period, you have many different options for optimizing the warm-up period. See Analyzing and Tuning Warm-up for more information.
When running your performance tests, make sure that you have given the test enough time to warm up before beginning your measurements. Remember, short-running microbenchmarks may not show the real-world benefits of Zing. If you are impressed by Prime’s fully optimized performance but warmup times are a concern, see ReadyNow, Azul Prime’s answer for fast starts.
|
Note
|
JIT optimization is often only one part of what is commonly seen as "warm-up". Other parts of warm-up include initializing resources needed by the application, rehydrating data from caches, etc. If you are experiencing long warm-up times, make sure to analyze everything that is happening during warm-up. |
JMX Beans
Prior to JDK 17, standard Java MX Beans did not properly track heap usage by JVMs with concurrent garbage collectors. Standard JMX Beans before JDK 17 could not tell the difference between a GC pause and a GC concurrent collection cycle, so they marked everything as pauses. Monitoring tools that rely on standard JMX Beans often report longer GC pause times for Zing’s C4 garbage collector than for Stop The World garbage collectors like G1 and CMS. In general, you shouldn’t measure GC cycles with standard OpenJDK JMX metrics.
Other frameworks or deployment models may make decisions based on heap usage as reported by standard JMX Beans. This can cause changes in behavior when you run these apps on Azul Prime. This is because they look at overall heap usage, which see-saws. You should care more about the live set than the total heap use.
Azul Prime publishes its own set of JMX Beans that you can integrate with, in order to get consistent and reliable results. You can enable ZingMXBeans using the -XX:+UseZingMXBeans flag. See Monitoring the Zing JVM Using JMX and Azul Prime MXBeans for more details.
Different Java Command-Line Options
Zing supports the majority of OpenJDK Java command-line options. The options that Zing does not support, it ignores. Your application should always run even without having to change command-line flags.
Zing also has its own set of Java command-line options. Some of these, like the options for controlling compiler threads, are replacements for OpenJDK command-line options. To mimic the same behavior as in OpenJDK, you may have to update some command-line options for your application.
In many cases, tuning your JVM with command-line options is much simpler with Zing. For example, you can more or less delete all the command-line options around tuning Parallel GC. For most parts, C4 only needs to be given a heap size.
We love to talk about Java
We’re here to answer any questions about Azul performance, warmup, pricing, or anything Java. Want to better understand what you can expect from Prime? Let us guide you!