Metrics Configuration in Azul Payara
|
Important
|
MicroProfile Metrics was made optional in MicroProfile starting from version 7.0, having been replaced by MicroProfile Telemetry. Users upgrading from versions prior to Azul Payara Community 7.2026.8 and Azul Payara 7.4.0 (which provided MicroProfile 6.1 support) should migrate to MicroProfile Telemetry, which is the recommended observability API going forward. |
|
Note
|
Azul Payara Server and Micro continues to support MicroProfile Metrics as a standalone feature even though it was made optional starting from MicroProfile version 7.0. However, MicroProfile Metrics support in Azul Payara Micro is planned for deprecation in a future release. Users are encouraged to migrate to MicroProfile Telemetry as the long-term observability solution. |
On Payara Server, the MicroProfile Metrics service can be configured by using Admin Console or Asadmin commands.
|
Important
|
MicroProfile Metrics is deprecated in favor of OpenTelemetry metrics. The Prometheus /metrics endpoint is retained for now, but users should migrate to OpenTelemetry metrics for new deployments.
|
Payara Micro doesn’t have a convenient solution for its MicroProfile Metrics service configuration yet.
Using the Admin Console
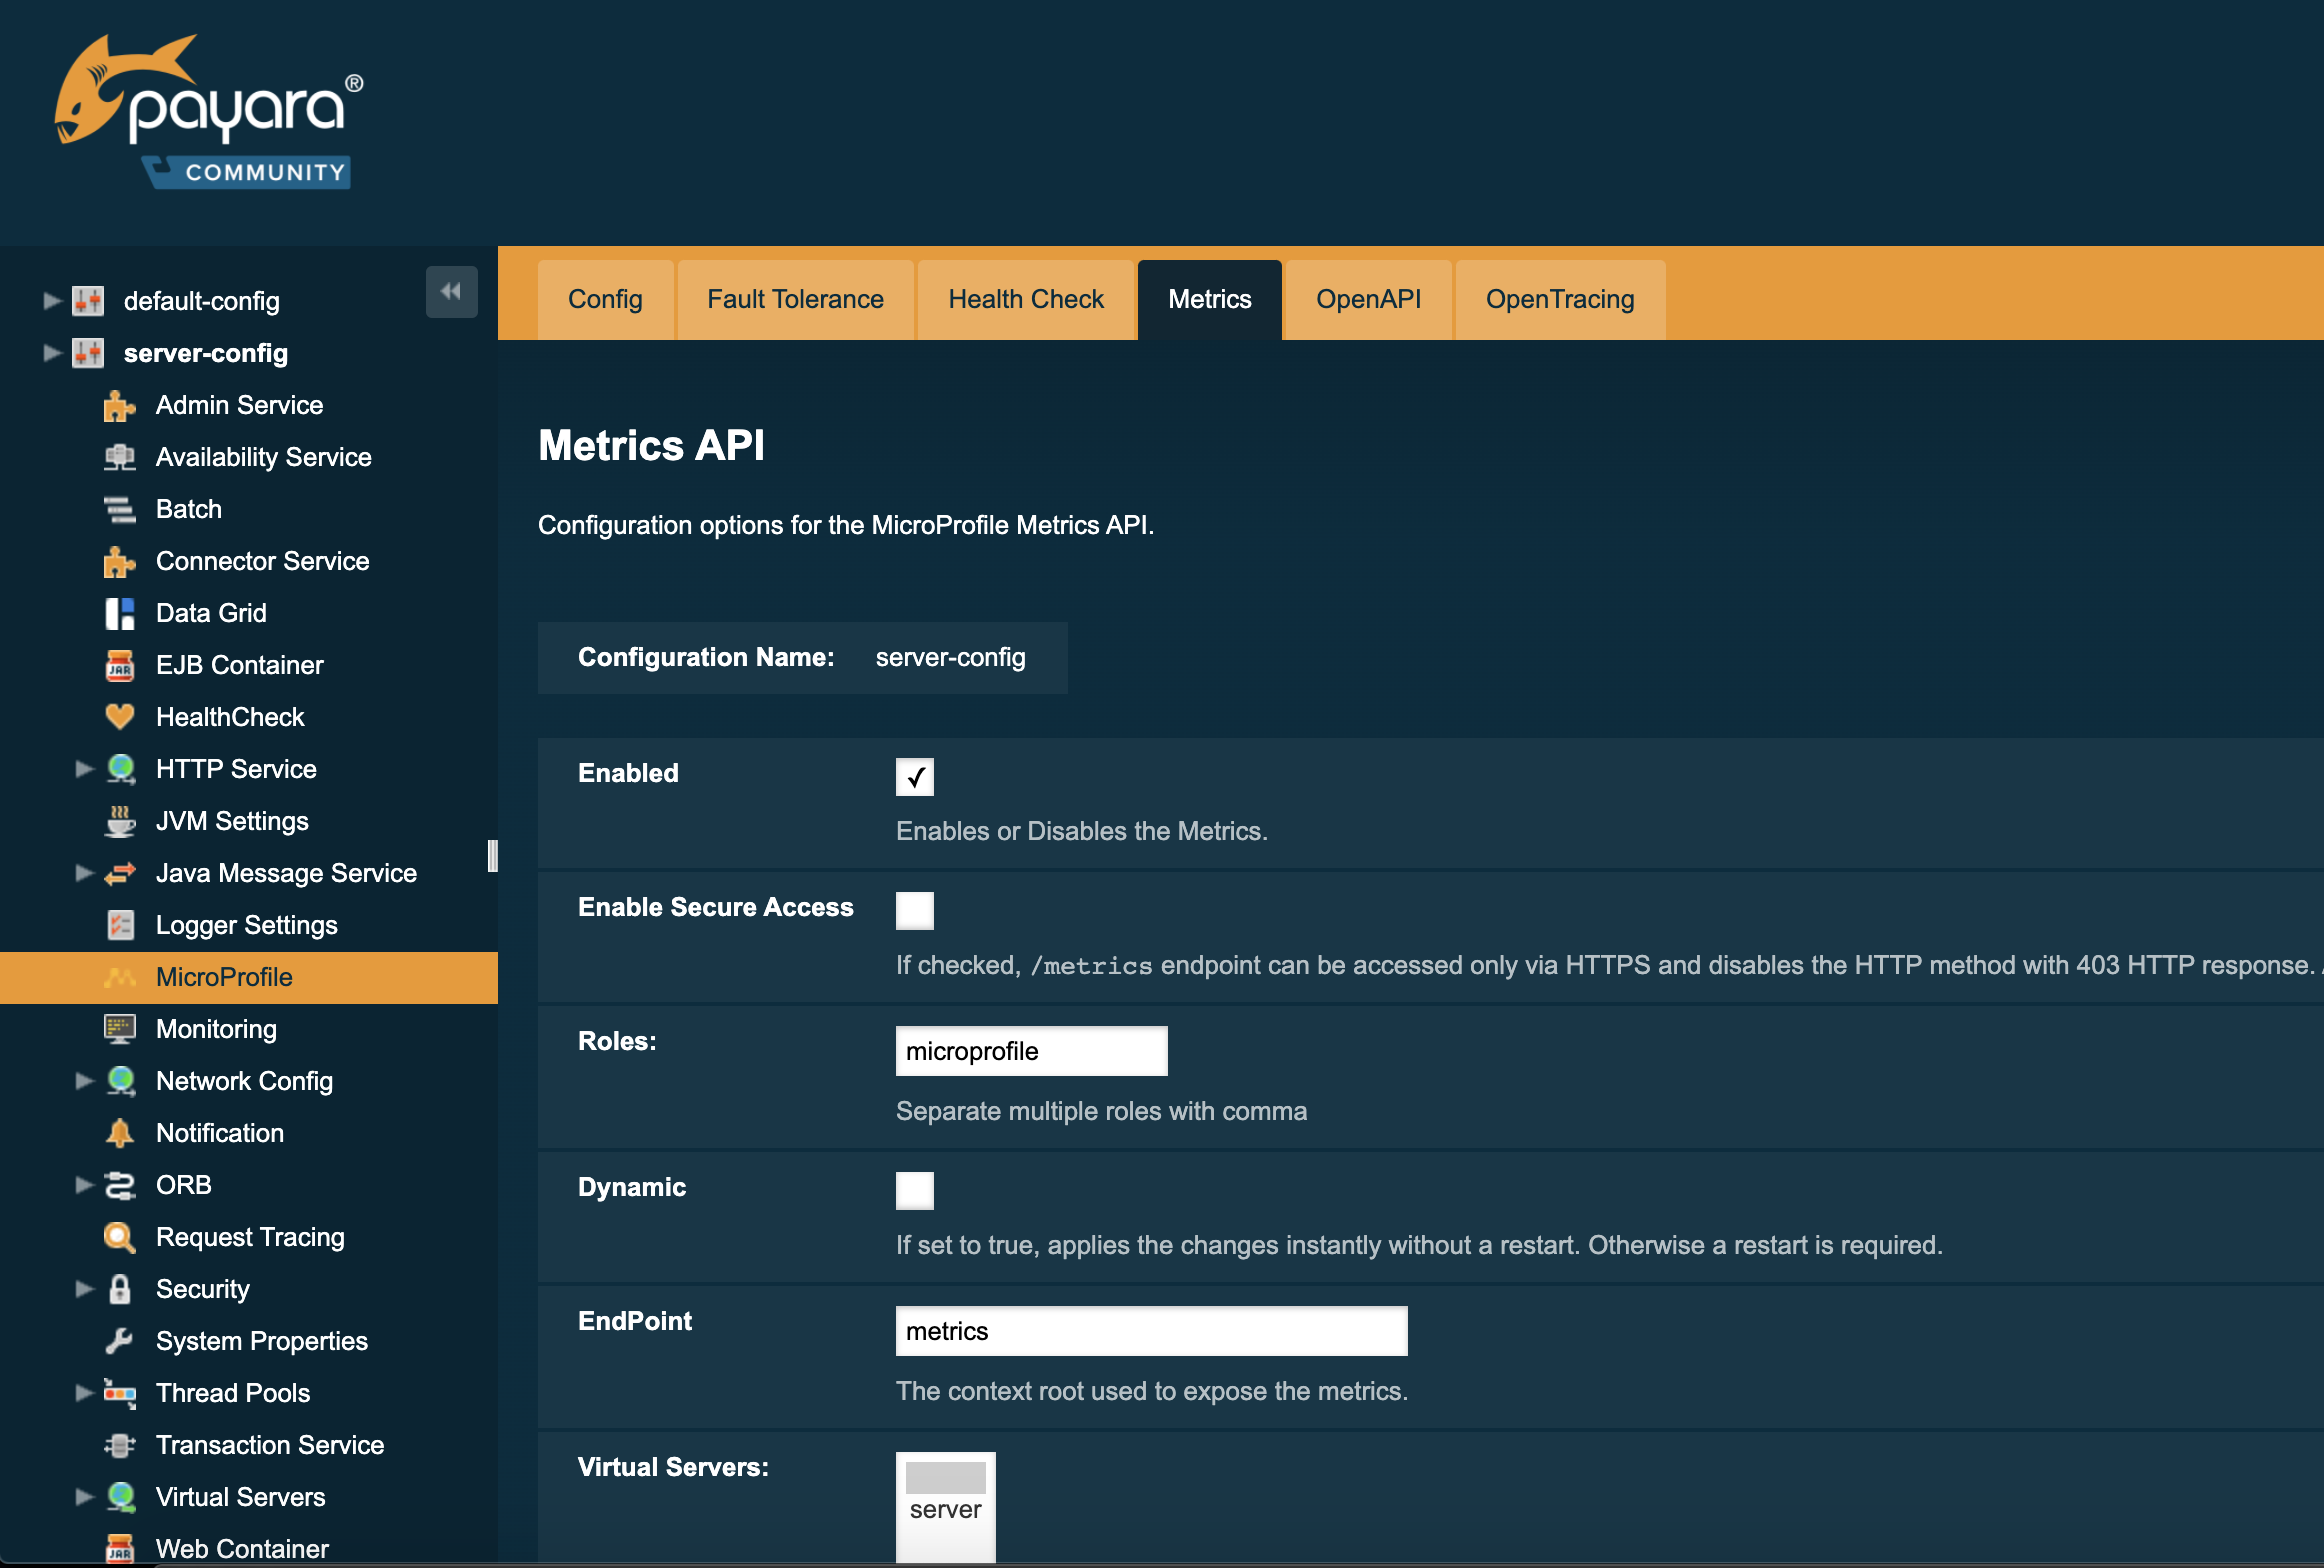
To configure the Metrics in the Admin Console, go to Configuration → [instance-configuration (like server-config)] → MicroProfile → Metrics:
Using Asadmin Commands
Use the following commands to manipulate the configuration settings of the service:
Security Configuration Considerations
By default, the MicroProfile Metrics endpoint binds to the root context application which is the default-web-module (also known as docroot) system application and the default-web-module application, which is secured under the default realm (file) of the server domain.
If a user application is deployed in the empty context-root, then the security configuration of this application will be shared by the MicroProfile Metrics endpoint, so exert extreme caution when making these changes.